Download
1 / 27
270 likes | 480 Vues
EMR use is not associated with better diabetes care Patrick J. O’Connor, MD, MPH, A. Lauren Crain, PhD, Leif I. Solberg, MD, Stephen E. Asche, MA, William A. Rush, PhD, Robin R. Whitebird, PhD, MSW. Electronic medical record (EMR). $10+ billion spent on EMR in last 5 years

E N D
EMR use is not associated with better diabetes carePatrick J. O’Connor, MD, MPH, A. Lauren Crain, PhD, Leif I. Solberg, MD, Stephen E. Asche, MA, William A. Rush, PhD, Robin R. Whitebird, PhD, MSW
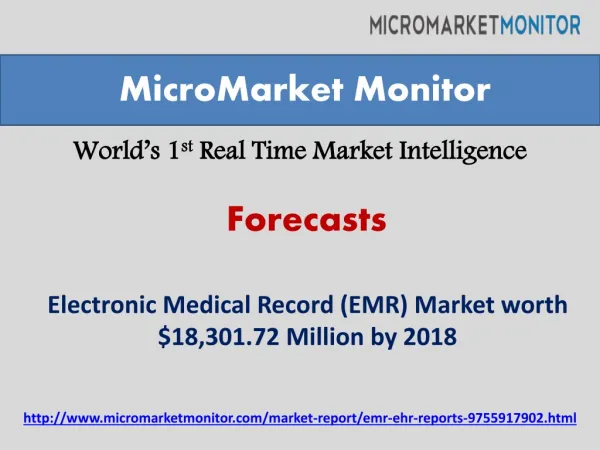
Electronic medical record (EMR) • $10+ billion spent on EMR in last 5 years • 300 EMR vendors (EMR Institute) • Office EMRs now used by > 35% of physicians • Typical features of an EMR: • High expectations that EMRs will improve care quality since 1980; IOM reports 1992
Research Question • Do patients receiving care at clinics using EMRs have better quality of diabetes care, compared to patients receiving care at clinics not using EMRs?
Project Quest • Multi-site 3 year study involving 19 medical groups, 85 clinics, 700 providers and 7865 adult DM or CHD patients • Designed to identify patient, physician, and clinic factors related to quality of care for adults with diabetes or heart disease • Funded by Agency for Healthcare Research and Quality (AHRQ)
Project Quest Diabetes Sample • Diabetes patients in 1998 (based on ICD-9 and pharmacy codes) • HealthPartners insurance in 1998 • 19+ yrs old in 1998 • Returned patient survey • Self-report confirmed having diabetes • Consented to chart audit • Linked to a clinic in which a clinic medical director completed a survey • N=1,491 DM patients from N=60 clinics
Data Sources • Administrative data • Diabetes determination (based on diagnosis & pharmacy codes), limited demographic information • Patient survey (2000) • Socio-demographic information • Clinic medical director survey (2000) • Report on use of EMR • Other clinic variables • Chart audit (1999, 2000, 2001) • HbA1c, LDL, SBP (last in each year)
EMR item • “Does your clinic use computerized medical record systems that include provider entry of data” • Asked of 60 clinic medical directors • 14 / 60 (23.3%) replied “yes”
Diabetes patients at clinics with and without an EMR * p < .05
Diabetes patients at clinics with and without an EMR Year 2001 clinical values. Bivariate analysis. * p < .05
Multilevel analysis • Uses clinical values in all 3 years • Models clinical value pooled across all 3 years, and change in clinical values over time • Models time within person within provider within clinic (“clean” hierarchy) • Used MLWin • Patient covariates: age, sex, education, duration of DM, Charlson score, CHD disease, BMI • Provider covariate: physician specialty
Multilevel analysis: HbA1c and change in HbA1c Patient and provider covariates included Change over time analysis: LR test p=.14
Multilevel analysis: LDL and change in LDL Patient and provider covariates included Change over time analysis: LR test p=.37
Multilevel analysis: SBP and change in SBP Patient and provider covariates included Change over time analysis: LR test p=.90
Strengths of Study • Large number of patients with diabetes • Multiple data sources (patient, provider, clinic medical director) • Use of hierarchical analytic models to accommodate nested data • Uniform data collection procedures and standards at all clinics
Potential Limitations • Study only involved 60 clinics in one state, generalizability to other regions or patient populations is uncertain • Observational study precludes causal inference • Clinic systems already in place • Didn’t examine process measures as dependent variables (e.g., test rates) • Clinic EMR use examined in isolation (no other clinic variables considered in same analysis) • We don’t have information on 1) features / functionality of the EMR, 2) extent to which EMR is used, 3) extent to which practitioners are trained to use the EMR • Some patients may link to multiple doctors, who link to multiple clinics, but we have simplified the hierarchy
Conclusions • EMR use not associated with better glucose, BP, or lipid control in adults with diabetes
Compare to Other Studies • Meigs ’02 at Mass General Clinics—EMR increased A1c tests but did not improve A1c level • Montori ’02 at Mayo—EMR improved number of A1c tests but did not improve A1c or LDL level • O’Connor ’01 at HPMG—EMR use led to more A1c tests, but worse A1c levels • Crabtree ’06 at NJ clinics—EMR using clinics no better than non-EMR for DM care
Implications • Anticipated benefits of very expensive EMRs for improving diabetes (and other chronic disease) care have yet to be realized • Office systems not yet redesigned to take advantage of EMR potential • Physician training to use EMRs not standardized or optimized • More research needed if the potential of very expensive EMRs to support better care is to be realized
Questions or Comments Patrick.J.Oconnor@ HealthPartners.com
Diabetes identification Diabetes identified using a method with estimated sensitively of 0.91 and positive predictive value of 0.94. Data on A1c and CHD were obtained from a medial record review. See paper draft for detail
Recruitment rates, sampling • QUEST successfully recruited: • 19 of 22 eligible medical groups • 85 of 86 eligible clinics within those medical groups • See paper draft for details on sampling: 19 MG, all clinics in these MG, minimum of 10 pts per clinic (DM and CHD sample)
Survey response rates • Survey response rates of medical groups (100%), clinics (98%), providers (55%) and chart audit consent rate of patients responding to surveys (about 80%) exceeded levels needed to power the analysis.
Patient Factors Analyzed *Age *Educational Level *Duration of Diabetes *Comorbidity *Gender *BMI
Physician Factors Analyzed Years Experience (Post-Residency) Gender Specialty (FP, IM)
Measures of Clinic Systems in Clinic Surveys • Expanded Roles for Nurses/Teams • Registries • Electronic Medical Records • Monitoring of Clinical Status • Prioritization based on Risk, RTC • Active Interventions: • Visit Planning • Active Outreach • Patient Activation
Where is the Variance? --80-90% of variance at Patient/Time level --5% of variance at Physician level --5% of variance at Clinic level --2-4% of variance at Medical Group level