Process Mapping
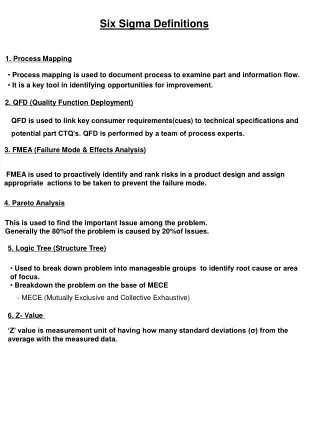
Process Mapping. John R. Grout Berry College Campbell School of Business Mount Berry, Georgia 30149-5024 jgrout@campbell.berry.edu Voice: (706) 238-7877 Fax: (706) 238-7854. Outline. Processes Intro to process mapping Why process mapping? Process Attributes Design emphasis

Process Mapping
E N D
Presentation Transcript
Process Mapping John R. Grout Berry College Campbell School of Business Mount Berry, Georgia 30149-5024 jgrout@campbell.berry.edu Voice: (706) 238-7877 Fax: (706) 238-7854
Outline • Processes • Intro to process mapping • Why process mapping? • Process Attributes • Design emphasis • Process FMEA prerequisite • Complexity or difficulty • Who manages the process? • Caveats • More on process mapping
A definition of “process” • “A collection of interrelated work tasks, • Initiated in response to an event • Achieving a specific result for the customer and other stakeholders of the process.” Source: Sharp and Mc Dermott Workflow Modeling 2001
Processes • Customer = recipient or beneficiary of result produced by the process. • Interrelated = the completion of one task initiates the next task in the process. • A triggering event, which involves the customer, marks the start of the process. • Achieving the specific result for the customer marks the end of the process.
Processes are supported by enablers • Workflow design • Information technology • Motivation and measurement • Human resources • Policies and rules • Facilities
Sub-processes • A process can be made up of processes, often called sub-processes • Defining “the process” and its boundaries depends on your perspective • The event that initiates a process could be part of a larger process.
Process vs. Task • Everyday usage: no universal distinction • For our purposes: • Processes involve more than one person, coordinated effort is required. • Tasks involve one person Theory of ones: Every process must be justified -- why can’t the result be achieved in one activity, by one person, at one time? Source: Harrington, Business Process Improvement Workbook
Process maps • A graphical presentation that document the tasks and other aspects of processes • Familiar version know as flow charting • Numerous formats or approaches exist • 2 versions of a process map are common: • As-is: the current state of the process • To-be: the goal state of the process • Widely used. Not widely researched.
Process Mapping Basics • Arrows and Icons • Lots of approaches • Best for Medicine? consult consult consult consult appt Mammo gram Phys- ical Patient General Practitioner appt Phys- ical consult Rec’v Radiology send Mammo gram Dev- elop appt appt Consult Sched/ orders Surgeon Sched/ orders Hospital Error #1 Pathology Radiological Oncologist Consult Medical Oncologist Consult Physical therapist
Likely results of process mapping • Increased understanding of process, • Increase consensus about the process, • Increased visibility into the process. Those who assume they know the process, without having mapped it, will probably find surprises when they map the process.
Dimensions of process mapping approaches • Level of detail • Multi layered (Nested or Hierarchical?) • Multiple types of flows • Shows hand-offs (organizational structure) • Icons • Logical operators • Flow time • User support information
Identifying risks and hazards:Caveats • “In some cases, it is easier for customers to define the business process because they are the only one who see it all.” (Sharp & McDermott) • From customer’s perspective, the process may often involve multiple sub-processes. • Optimal sub-processes will not result in optimal customer processes
Identifying risks and hazards:Caveats • Optimization of sub-processes usually leads to suboptimization of processes* • Sub-processes should be designed to contribute to global optimality. • Carefully crafted sub-optimal (“inefficient”) sub-processes will be required for optimal customer outcomes *Goldratt, The Goal, North River Press 1984
Process MappingFlowchart Books on the subject: Galloway, Dianne (1994) Mapping Work Processes, Milwaukee, Wisconsin: ASQ Quality Press. Harrington, H. James, Esseling, Erik K. C., and Van Nimwegen, Harm (1997) Business Process Improvement Workbook New York: McGraw-Hill. Damelio, Robert (1996) The Basics of Process Mapping, Portland, Oregon: Productivity Inc
Process Mapping:Top-Down Process Map • Sub-processes are listed under each major process • Minimal graphics – could be text-only indenting sub-processes in an outline format Books on the subject: Wilson, Ray W. and Harsin, Paul (1998) Process Mastering: How to Establish and Document the Best Known Way to Do a Job. Portland, Oregon: Productivity Inc.
Process Mapping:Top-Down Flow Chart 5 4 2 3 1 PSA test ordered PSA test ordered PSA test ordered PSA test ordered PSA test ordered • Subprocesses • Telephone • Visit setup • Result • Subprocesses • Report Received • Subprocesses • ID patient • Select proper equip • Draw blood • Label • Subprocesses • Review • Centrifuge • Verify calibration • Run QC • Run sample • Report results • Enter in CPRS • Subprocesses • Order Written • Entered in CPRS • Received in lab DeRosier et al. joint commission Journal on Quality Improvement (28)5: 248-267.
(information) Process # Sub-process reference # (tools & equipment) Process MappingIDEF0 Pronounced “eye-def zero” Meaning boxes and arrows: Source: http://www.itl.nist.gov/fipspubs/by-num.htm
General Detailed Process MappingIDEF0 • Nested or Hierarchical Diagrams Source: FIPS 183 available at http://www.itl.nist.gov/fipspubs/by-num.htm
Web-based example Process MappingIDEF0 Books on the subject: Federal Information Processing Standards (FIPS)183: Integration Definition for Function Modeling (IDEF0) http://www.itl.nist.gov/fipspubs/by-num.htm Hunt, Daniel V. (1996) Process Mapping: How to Reengineer Your Business Processes, New York: John Wiley & Sons.
Process MappingSwimlanes Books on the subject: Sharp, Alec, and McDermott, Patrick (2001) Workflow Modeling: Tools for Process Improvement and Application Development, Boston: Artech House. Frazier, Jane C. (2001) Swimlane Process Mapping, Walnut Creek, CA: Frazier Technologies, Inc. (www.fraziertech.com) Jacka, J. Mike and Keller, Paulette J. (2001) Business Process Mapping: Improving Customer Satisfaction New York: John Wiley & Sons. Flowchart superimposed on a grid Grid rows are organizations, departments, functions, or individuals Grid columns are chronological Team or joint activities indicated by boxes
Process MappingSwimlanes: Susan’s Lumpectomy consult consult consult consult appt Mammo gram Phys- ical Patient General Practitioner appt Phys- ical consult Rec’v Radiology send Mammo gram Dev- elop appt appt Consult Sched orders Surgeon Sched orders Hospital Error #1 Pathology Radiological Oncologist Consult Medical Oncologist Consult Physical therapist
Process MappingSwimlanes: Susan’s Lumpectomy treat Pre- admit Surg- ery Consult treat Consult Request report Study report Patient General Practitioner Radiology Surg- ery Surgeon Error #1 caught by patient Pre- admit Surg- ery Hospital send Pathology Rec’v samp Anal- yze Type up Radiological Oncologist … Error #2 Consult treat Plan treat Medical Oncologist Plan treat Consult Physical therapist … Error #2 caught By patient Consult treat treat
Process MappingValue Stream Mapping Rother, Mike and Shook, John (1999) Learning to See, Brookline, MA: Lean Enterprises Institute Inc. Tapping, Don, Shuker, Tom and Luyster, Tom (2002) Value Stream Management Productivity Press.
As tasks are linked into “one-piece flow” they are combined on the map Process MappingValue Stream Mapping Ordering and Scheduling info Production task & Inventory info Includes information On elapsed time
Process MappingValue Stream Mapping • 24 icon set for lean manufacturing