Tools for Investigating Graphics System Performance
Tools for Investigating Graphics System Performance. Matthew Fisher Steve Pronovost. Goal. A video game runs slowly, skips frames, has high latency, etc. and the developers want to fix this problem

Tools for Investigating Graphics System Performance
E N D
Presentation Transcript
Tools for Investigating Graphics System Performance Matthew Fisher Steve Pronovost
Goal • A video game runs slowly, skips frames, has high latency, etc. and the developers want to fix this problem • The problem is almost always a cascade of bottlenecks at the application, CPU, and GPU levels that is very challenging to investigate locally • We want tools that lets programmers solve these problems faster
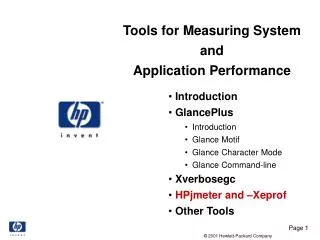
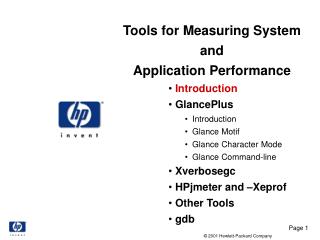
Approaches • Profiling • Rig the game events with logging or use an automatic profiler • PIX (for Windows and Xbox 360) • All calls by the game to the graphics API are logged • GPUView • OS logs all CPU, graphics kernel and graphics driver events
Profiling • Manual profiling requires a significant amount of development effort • Polling-based automatic profiling can work reasonably well for CPU applications but doesn’t capture graphics or memory transfer events well • Percentage-based statistics (“you spent 45% of the time in function X”) can sometimes be useful and sometimes extremely misleading
PIX • Released by Microsoft as part of the DirectX SDK • Multiple modes for investigating performance targeted at game developers • Interactive mode • Frame logging • Frame capture and playback
PIX – Interactive Mode • Various counters stream by as the game runs • You can change the counters, hope is to find that the observed problem correlates with one of the counters
Commonly Used Counter Types • Number, type, and size of draw primitive calls • Number of texture, vertex/index buffer locks, and what memory pool was locked • Object creation and destruction events • Allocated system and video memory • Frame latency, seconds per frame • Page faults
Questions PIX is good at • Are object locks causing the frame skipping problem users are experiencing? • Are we allocating too many resources we don’t use? • What are the API calls that are taking the longest time to execute? • Why was this pixel in the sky green?
Windows Display Driver Model • The XP Display Driver Model required applications to cede control of the graphics infrastructure and was largely designed assuming a single 3D application would be running • The Vista Display Driver Model added standard scheduling principles forcing applications to share control of graphics memory and compute resources
GPUView • The graphics model switch induced a variety of constraints on graphics applications and forced highly optimized graphics drivers to be restructured • Many games were running more slowly on Vista than they did on XP (~5% - 30% slower) • GPUView was designed to help investigate these problems and see what stage was causing the speed difference
Event Tracing • The GPUView logger enables logging of a vast set of events in the OS, such as • All calls to the Windows graphics kernel • All resource creation, lock, destruction, etc. events • All command buffer submissions • Context switches (w/ stack trace and reason) • Kernel mode enter/exits (w/ stack trace) • World of Warcraft generates approximately 1GB every 3 seconds
Windows Display Driver Model • Applications build up local command buffers • When these command buffers get big enough they are submitted to the application’s local graphics queue for processing • The graphics scheduler selects which application should be running on which graphics card and submits work to the corresponding hardware queue
Thoughts • Surprisingly, the overhead of GPUView logging is pretty minimal and the traces often reflect the underlying problem well • The biggest advantage of GPUView over PIX is that PIX can’t tell you crucial things like when the GPU is blocked on the CPU • GPUView is excellent for telling you what part of the application needs optimization
Driver Perspective • Provides a lot of detail to let display driver writers and the DirectX graphics kernel diagnose problems with task submission, the command buffer submission threads, GPU preemption, video skipping, etc.