Download

1 / 8
80 likes | 216 Vues
Lets-Viz specializes in providing professional data analytics consulting services that enable businesses to gain valuable insights from their data.

E N D
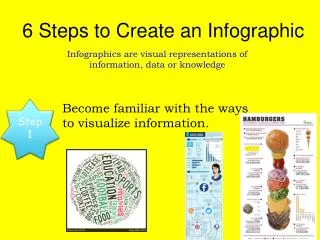
In the top 6 steps, you can create reports in Zoho Analytics.
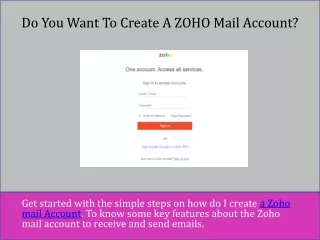
Data Integration and Preparation When you log in to your workspace, you are taken to the data import window. Data can be imported from over 250 third-party data sources, Zoho apps, and emails. If you are not redirected immediately, select the "Import Your Data" option in your workspace.
Create Report by Drag-and-Drop fields After you created your workspace, under your imported data in the top left corner, there is an option to create. There are a number of tableau reports you can create on Zoho. Pivot view, summary view, and tabular view are mostly the same.
Customize Your Report There are a few things you should know to customise your report created in Zoho Analytics. Zoho had two modes. View Mode and Edit Mode for each report Edit mode is where you can select columns, add filters and user filters, and add tooltips. In view mode, you can share and export your visualisation. To customise your report, you need to select settings available in both views. In settings, we can change colour (legend), axis names, the effect of the chart, and drill-down option customization.
User-Filter With reports, Zoho provides a user filtering option. These filters are specific to user control. This filter's behaviour and default values can be customised. Zoho Analytic additionally provides factors such as variables, which are used in conjunction with user filters to govern chart behaviour. In compared to other BI tools, Zoho has its own set of strengths and shortcomings, and it excels at self-service BI.
User-Filter Zoho offers a user filter option with reports. These filters are specific to user control. You can customise the behaviour and default values this filter can show the user. Zoho analytic experts also offer parameters like variables, which are used with user filters to control chart behaviour. In compared to other powerful BI tools, Zoho has its own set of strengths and shortcomings, and Zoho excels at self- service BI.
Contact Us +91-9560-300-962 info@letsviz.com www.lets-viz.com Sector 16B, Noida, Uttar Pradesh 201301