Download
1 / 25
270 likes | 1.19k Vues
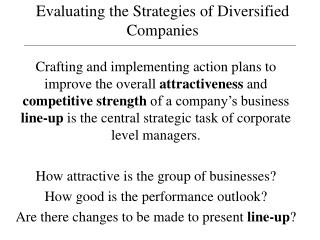
Evaluating the Strategies of Diversified Companies. Crafting and implementing action plans to improve the overall attractiveness and competitive strength of a company’s business line-up is the central strategic task of corporate level managers. How attractive is the group of businesses?

E N D
Evaluating the Strategies of Diversified Companies Crafting and implementing action plans to improve the overall attractiveness and competitive strength of a company’s business line-up is the central strategic task of corporate level managers. How attractive is the group of businesses? How good is the performance outlook? Are there changes to be made to present line-up?
Evaluating the Strategies of Diversified Companies Identifying the present corporate strategy Applying the industry attractiveness test Applying the competitive strength test Applying the strategic fit test Applying the resource fit test Ranking businesses on historic & future Ranking businesses on priority for resource allocation Crafting new strategic moves
Identifying the Current Strategy Type of diversification Extent of diversification Scope Recent / Impending moves Efforts to capture fits % Total Cap Ex per unit in prior yrs What is current corporate strategy & rationale
Evaluating Industry Attractiveness *** Individual - Relative - Collective *** Individual Mkt size, projected growth, profitability Intensity of competition Threats / Opportunities Seasonal / Cyclical factors Capital requirements Fits with present businesses Social, political, regulatory, environmental factors Degree of risk / uncertainty
Evaluating Industry Attractiveness Relative Attractiveness Select industry measures Assign weightings (sum = 1.0) Rate industries according to a scale eg. 1-10 The sum of the weighted ratings provides a quantitative measure of the attractiveness relative to other industries Rank the industries
Relative Industry Attractiveness Measures Weighting Ratings (1-10) Ind. Attract. Co.A Co.B Co.C A B C Mkt size .1 6 2 5 .6 .2 .5 Growth Rate .15 1 8 5 .15 1.2 .75 Intensity (comp) .3 2 9 5 .6 2.7 1.5 Resource reqs .1 3 5 5 .3 .5 .5 Strategic fit .15 6 8 5 .9 1.2 .75 Opps / threats .05 1 6 5 .05 .3 .25 Social, political… .05 1 4 5 .05 .2 .25 Degree of risk .05 1 4 5 .05 .2 .25 Industry profitability .05 7 5 5 .35 .25 .25 3.05 6.75 5.0 1.0
Evaluating Industry Attractiveness Collective Attractiveness Attractiveness of mix of industries as a whole A substantial portion of revenues & profit (& principal businesses) should come from bus. units in attractive industries Businesses in least attractive industries are divestiture candidates
Evaluating Competitive Strength Measuring strength of position of business within their industries Choose measures - relative mkt share Assign weights - ability to compete on cost Use rating scale - ability to match quality Rank (> 6.7 strong, - leverage < 3.3 weak) - fits, skills, capabilities - brand recognition / reputation - profitability relative to competit.
Industry Attractiveness / Competitive Strength Matrix Business mkt share 3.3 6.7 High Med Low Industry size 6.7 LT Industry Attractiveness 3.3 Strong Average Weak Competitive Strength Position Investment priority General Strategic Prescription Overhaul/Reposition/Divest Low Priority Selective Investment Medium Grow & Build High
Ind. Attractiveness/ Business Strength 9 Cell Matrix (GE) • Takes many strategic variables into account • Allows for weighting & range of rankings • Use to prioritize investments & channel funds • No real guidance on specifics of business strategy • Doesn’t address strategic coordination issues • Doesn’t adequately deal with new business in emerging industry
BCG Growth Share Matrix Relative to economy as a whole Relative Market Share (volume) Hi 1.0 Lo Hi QUESTION MARK/ PROBLEM CHILD STAR size of circle represents revenue Industry Growth Rate CASH COW DOG Lo
Growth Share Matrix • Developed by Boston Consulting Group • Relative market share better indicator of business strength than actual market share • Eg. You have 10% share • Market leader has 20% : relative share is 0.5 • Market leader has 50%: relative share is 0.2 • Based on volume - PIMS study: market share is indicator of business strength
Question Marks • Low share in emerging industry • Cash hogs/ need investment • rapid growth • high costs (low scale econ/ experience effect) • Action • Invest and produce a star • Divest and use resources elsewhere ?
Stars • High share in emerging industry • Need investment/ working capital due to high growth • may provide from internal funds • but may be cash hogs • Will sustain the diversified firm into the future
Cash Cows • High share in mature industry • Generates large amounts of cash • Not all needs to be reinvested • Funds other businesses (stars/ question marks) • Important to maintain • Market position • Operating efficiencies
Dogs • Low share in low growth industry • many can still perform well • esp. if low scale econonies/ experience effects • eg. Crown Cork and Seal • get rid of weak dog businesses
Growth Share matrix • Cash cows fund cash hogs • Success sequence • Question mark - star -self funding star - cash cow funds
Growth Share Matrix • Disaster sequence • 1) star-? -dog • 2) cash cow - dog • Don’t • Overinvest in cash cow • Overinvest in ? with little potential • Dilute resources by investing in too many ? 1a 1b 2
Growth Share Matrix • Encourages strategist to view diversified firm as collection of cash flows & requirements • But has weaknesses • Oversimplified : 4 categories/ 2 dimensions • Being a leader in a slow-growth industry doesn’t guarantee cash cow status • Doesn’t analyse ‘average’ business • Doesn’t indicate best investment opportunity • Assessing attractiveness involves more than industry growth & RMS • Connection between RMS & profitability not as tight as implied
Strategic Fit Analysis Identifying competitively valuable matches in value chains in portfolio Whether each unit fits well with firm’s LT strategic direction The greater the competitively valuable fits the greater the potential for economies of scope.
Strategic Fit Analysis Logistics Technology Sales/Mkg Distribution A B C Logistics / Ops FITS Tech, skills No fit opportunities Sales, mkg, distribution
Resource Fit Analysis When businesses add to a company’s strengths either financially or strategically A company must have the resources to support the resource requirements of its group of businesses Enough cash cows to finance the cash hogs with potential to be star performers
Deciding allocation priorities & General Direction for each Business Unit Concentrate resources on businesses with good to excellent prospects. Allocate minimal resources to those with sub-par prospects. Steering resources out of low opportunity areas into high opportunity areas. Strategic Options - Invest & Grow - Fortify & Defend - Overhaul & Re-position - Harvest & Divest
Crafting a Corporate Strategy Right mix of businesses? Ample fit? Unnecessary businesses? Enough cash cows to finance cash hogs with potential to be star performers? Can the principal business be counted on to generate dependable profits and cash flows? Does the make-up put the co. in a good position for the future? COMPOSITION & COORDINATION
Crafting a Corporate Strategy Q. Can the company attain its performance objectives with the current line-up of businesses and resource capabilities? A. Yes - no major corporate strategy changes needed A. No - alter plans for some or all businesses - add new businesses - divest weaker businesses - form alliances to strengthen existing businesses - upgrade co. resource base - lower co. performance objectives Strategy & analysis tends to emerge incrementally