Download
1 / 54
540 likes | 795 Vues
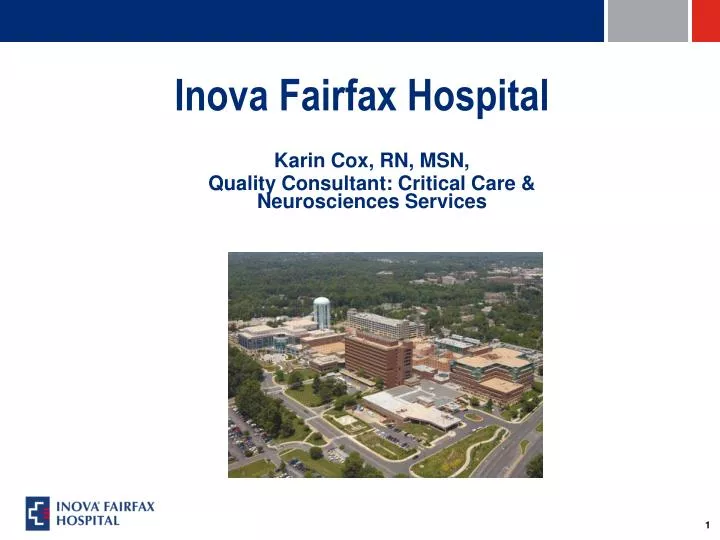
Inova Fairfax Hospital. Karin Cox, RN, MSN, Quality Consultant: Critical Care & Neurosciences Services. Inova Fairfax Campus. 833 licensed beds 2 million square feet 36 Off-site properties >7,000 employees Quality Staff of 13.5 Outcomes Staff of 16. What we will cover .

E N D
Inova Fairfax Hospital Karin Cox, RN, MSN, Quality Consultant: Critical Care & Neurosciences Services
Inova Fairfax Campus • 833 licensed beds • 2 million square feet • 36 Off-site properties • >7,000 employees • Quality Staff of 13.5 • Outcomes Staff of 16
What we will cover • History of Quality Efforts in Healthcare • What is an Ideal Healthcare System • Role of the Quality Consultant • Quality at Inova Fairfax Hospital
The Quality Professional’s Perspective • Do the Right Thing Right, the First Time • Continuous Process Improvement • Timeliness • Reliability • Efficacy • Availability • Affordability • Standardization • Freedom from Deficiencies • Customer Satisfaction
Quality from the Patient’s Perspective • Keep me safe • Heal me • Be nice to me In that order! Safety + quality + satisfaction = Excellent Care
Measuring Quality: Romeo and Juliet • I do remember an apothecary,--And hereabouts he dwells,--which late I notedIn tatter'd weeds, with overwhelming brows,Culling of simples; meagre were his looks,Sharp misery had worn him to the bones:And in his needy shop a tortoise hung,An alligator stuff'd, and other skinsOf ill-shaped fishes; and about his shelvesA beggarly account of empty boxes,Green earthen pots, bladders and musty seeds,Remnants of packthread and old cakes of roses,Were thinly scatter'd, to make up a show.
History of Quality: Florence Nightingale • Went to Scutari Hospital with 38 nurses • 3,000 – 4,000 soldiers • Deplorable conditions 43% mortality • Set up kitchens, laundry, basic sanitation, nursing • Mortality dropped to 3% • Nightingale Fund allowed independent endowment of St. Thomas School of Nursing
Foundation of Process Improvement • Set Standards • Measure
Voluntary Standards Formed • 1913 – American College of Surgeons founded • 1917 – Minimal Standards for Hospital – five • Physicians had to be graduates of School of Medicine • Physicians had to apply for Medical Staff privileges • Organized Medical Staff had to meet at least annually to review quality of care • Medical Record • Hospital services supervised by a qualified person
Voluntary Standards Formed • 1913 – American College of Surgeons founded • 1917 – Minimal Standards for Hospital – five • Physicians had to be graduates of School of Medicine • Physicians had to apply for Medical Staff privileges • Organized Medical Staff had to meet at least annually to review quality of care • Medical Record • Hospital services supervised by a qualified person • 1918 – First inspection • Only 89 out of 692 hospitals met standards
Pressure to Change: Standards Evolve • 1950s A time of change • Number of standards increases • 3,200 hospitals achieve standards • American College of Physicians, American Hospital Association, American Medical Association, Canadian Medical Association form the Joint Commission on Accreditation of Hospitals • 1965 Congress passes Social Security and “deems” that hospitals accredited by JCAH are able to participate in Medicare • 1970s Expansion and Segmentation • Nurses, Hospital Administrators, Dentists • Required submission of remediation plans
Pressure to Change: Standards Evolve (TJC) • Develop Standards for Different Types of Organizations • Hospitals • Behavioral Health • Ambulatory Care • Home Care • Critical Access (Rural) Hospitals • International • Develop Disease Specific Standards (as of 2002) • Stroke • Cystic Fibrosis • Renal Disease
Standards Proliferated in Many Areas • Rights and Ethics • Provision of Care • Medication Management • Infection Control • Performance Improvement • Environment of Care • Leadership • Medical Staff • Nursing • Human Resources
International Comparison of Spending on Health, 1980–2004 Average spending on healthper capita ($US PPP) Total expenditures on healthas percent of GDP Data: OECD Health Data 2005 and 2006. Source: Commonwealth Fund National Scorecard on U.S. Health System Performance, 2006 16
Wake Up Call in Public and Private Sectors • Fee for Service • Rewarded utilization • No incentives for quality • Discount in exchange for volume • Prospective Payment – Public Sector • DRG (Diagnosis Related Groups) • Prospective Payment – Private Sector • HMO’s • Capitation
Standards Evolve • Joint Commission 1980s “Agenda for Change” • Response to Criticism • First “Public” members • Outcome Measurements: Core Measures 1987 - 2001 • Sentinel Events
Different Approaches • TJC • Primary • Processes of care, continuum, communication, continuous improvement • Secondary • Inspection, deficiencies • CMS • Primary • Inspection, deficiencies • Secondary • Processes of care, continuum, communication, continuous improvement
Was it enough? • We created standards • We measured to these standards
Published 2000 by Institute of Medicine Adverse events occur in 2.9 to 3.7 % of hospitalizations 33.6 million hospitalizations per year in United States 44,000 to 98,000 adverse events per year Adverse events result in death 6.6 to 13.6 % Death due to medical errors as 8th leading cause of death To Err is Human
Responding to IOM Reduction in Federal reimbursement by 2% for not submitting data on Core Measures: How often a hospital adheres to evidence based clinical practice for heart attack, heart failure, pneumonia, surgery (2003) Transparency: Public website to display Core Measures results (2005) www.hospitalcompare.hhs.gov Reduction in Federal reimbursement by 2% for not submitting HCAHPS patient satisfaction data (2007)
Components of an “Ideal” Health Care System • Long, healthy, productive lives • Quality • Access • Efficiency • Equity • Capacity to innovate and improve
Mortality Amenable to Health Care Mortality from causes considered amenable to health care is deaths before age 75 that are potentially preventable with timely and appropriate medical care Deaths per 100,000 population* International variation, 1998 State variation,2002 Percentiles * Countries’ age-standardized death rates, ages 0–74; includes ischemic heart disease. See Technical Appendix for list of conditions considered amenable to health care in the analysis. Data: International estimates—World Health Organization, WHO mortality database (Nolte and McKee 2003); State estimates—K. Hempstead, Rutgers University using Nolte and McKee methodology. Source: Commonwealth Fund National Scorecard on U.S. Health System Performance, 2006 26
Medical, Medication, and Lab Errors Among Sicker Adults, 2005 Percent reporting medical mistake, medication error, or lab error in past two years International comparison United States, by race/ethnicity,income, and insurance status UK=United Kingdom; GER=Germany; NZ=New Zealand; AUS=Australia; CAN=Canada; US=United States. Data: Analysis of 2005 Commonwealth Fund International Health Policy Survey of Sicker Adults; Schoen et al. 2005a. Source: Commonwealth Fund National Scorecard on U.S. Health System Performance, 2006 27
Went to ER for Condition That Could Have Been Treatedby Regular Doctor, Among Sicker Adults, 2005 Percent of adults who went to ER in past two years for condition that could have been treated by regular doctor if available International comparison United States, by race/ethnicity, income, and insurance status GER=Germany; NZ=New Zealand; UK=United Kingdom; AUS=Australia; CAN=Canada; US=United States. Data: Analysis of 2005 Commonwealth Fund International Health Policy Survey of Sicker Adults; Schoen et al. 2005a. Source: Commonwealth Fund National Scorecard on U.S. Health System Performance, 2006 28
Percentage of National Health ExpendituresSpent on Health Administration and Insurance, 2003 Net costs of health administration and health insurance as percent of national health expenditures a b c * a 2002 b 1999 c 2001 * Includes claims administration, underwriting, marketing, profits, and other administrative costs; based on premiums minus claims expenses for private insurance. Data: OECD Health Data 2005. Source: Commonwealth Fund National Scorecard on U.S. Health System Performance, 2006 29
National Health Expenditures Invested in Research and Spenton Public Health Activities Compared with Administration and Insurance Costs, 2000 and 2004 Dollars (in billions) Percent of national health expenditures Data: CMS Office of the Actuary, National Health Statistics Group; and U.S. Dept. of Commerce, Bureau of Economic Analysis and U.S. Bureau of the Census (Smith et al. 2006). Source: Commonwealth Fund National Scorecard on U.S. Health System Performance, 2006 30
Scorecard-Related Publications • Cathy Schoen, Karen Davis, Sabrina K. H. How, and Stephen C. Schoenbaum, “U.S. Health System Performance: A National Scorecard,” Health Affairs Web Exclusive (Sept. 20, 2006):w457–w475. Available online at: http://content.healthaffairs.org/cgi/reprint/25/5/w457 • Commonwealth Fund Publications: • Commonwealth Fund Commission on a High Performance Health System, Why Not the Best? Results from a National Scorecard on U.S. Health System Performance (Sept. 2006). • Cathy Schoen and Sabrina K. H. How, National Scorecard onU.S. Health System Performance: Technical Report (Sept. 2006). • Cathy Schoen and Sabrina K. H. How, National Scorecard onU.S. Health System Performance: Complete Chartpack and Chartpack Technical Appendix (Sept. 2006). These Fund publications are available for free download onThe Commonwealth Fund’s Web site at www.cmwf.org. 31
Where are we now with Quality: Financial Accountability • 1987 - 2002: Hospitals were required to collect data and report on standardized – or “core” – performance measures. Failure to report results in reduced reimbursement. • Core Measures • Acute Myocardial Infarction (AMI) • Heart Failure • Pneumonia • Surgical Care • Asthma
Where are we now with Quality: Financial Accountability • 2008: Reduced reimbursement for HACs • Hospital Acquired Conditions • Specific types of Infections • Injury during hospitalization (fall, burn) • Retained foreign body • Skin breakdown stage III or IV • Wrong surgery • Blood transfusion mis-match • “Never” events
Where are we going? • Pressure on Federal Government to act • Many different stakeholders • Providers • Payors (Government, Private) • Regulators • Suppliers • Patients/Families • Recognition of the cost of poor quality • Leverage use of technology
Percent of Adults Ages 18–64 Uninsured by State 1999–2000 2004–2005 NH NH ME WA NH VT ME WA VT ND MT ND MT MN MN OR NY MA WI OR MA NY ID SD WI RI MI ID SD RI WY MI CT PA WY NJ CT IA PA NJ NE IA OH DE IN NE OH NV DE IN IL MD NV WV UT VA IL MD CO DC WV UT VA KS MO KY CA CO DC KS MO KY CA NC NC TN TN OK SC AR OK AZ NM SC AR AZ NM MS GA AL MS GA AL TX LA TX LA FL FL AK AK 23% or more HI HI 19%–22.9% 14%–18.9% Less than 14% Data: Two-year averages 1999–2000 and 2004–2005 from the Census Bureau’s March 2000, 2001 and 2005, 2006 Current Population Surveys. Estimates by the Employee Benefit Research Institute. Source: Commonwealth Fund National Scorecard on U.S. Health System Performance, 2006 35
Quality from the Patient’s Perspective • Keep me safe • Heal me • Be nice to me In that order! Safety + quality + satisfaction = Excellent Care
Role of Quality Consultant - Safety • Safety Huddle – weekly / daily message • Safety Coach program • Safety phone • Red rules • DNU abbreviations • HAM SALAD
Role of Quality Consultant - Safety • Rapid Response Team (RRT) • Environment of Care Tours • Safety Culture Survey • Medication Safety Oversight Committee • Site visits from one Inova facility to another
Role of Quality Consultant - Safety • Tubing Mis-connection project • Safety Fair • Data analysis for trends • Data mining and display • Root cause analysis • Board and Administrative Ownership is KEY
Role of Quality Consultant – Performance Improvement • LEAN • PDCA: Plan – Do – Check - Act • Collaborative Learning Communities • 100K Lives Campaign, Sepsis, Flow, Organ Donation • Team Facilitation • Bundle Compliance Teams • Clinical Effectiveness Teams
Role of Quality Consultant – Peer Review • Care Science, Crimson Initiative • Mortality, Morbidity • Indicator Development • Case Finding, Screening, Investigation • Chart preparation, Data entry, Minutes • Ongoing Professional Practice Evaluation (OPPE) • Focused Professional Practice Evaluation (new) • Focused Review • Credentialing Report
Role of Quality Consultant – Regulatory Readiness • Federal - CMS (Medicare and Medicaid) can survey announced or unannounced. • State - State surveys hospitals every two years with 48 hours notice; can also survey or investigate complaints unannounced • County - Fire Marshall can survey unannounced • The Joint Commission – Starting in 2006, TJC surveys became unannounced. Survey every three years; also conduct random unannounced surveys. • Other - There are a variety of other regulatory bodies that also conduct surveys - CARF, NRC, CAP, etc.
Role of Quality Consultant – Regulatory Readiness • Periodic Performance Reports (PPR) • Strategic Surveillance System (S3) • Outcomes Data: Core Measures, SCIP, Vermont – Oxford, NDNQI • Complaint Investigations • Mock Surveys (Dress rehearsal) • Gap analysis
Role of Quality Consultant – Challenges • Paper Records • Changing regulatory environment • “Blue” Rules • Competing Priorities • Integrating new technology • New Stakeholders • Demanding populations • Ethical issues – End of Life • Leadership “buy in”
Why is Quality Important to Inova Fairfax Hospital? • Our Mission: To improve the health of the diverse community that we serve, through excellence in patient care, education and research • Our Vision: To be the best healthcare system in the world • Our Core Values: • Caring for and about people • Innovation • Community responsibility
Inova Fairfax Accomplishments Health Grades One of the top 50 hospitals in the United States for the 2nd consecutive year. Ranked Best in Virginia for Cardiology Services for two years in a row (2009-2010) Ranked Best in Virginia for Treatment of Stroke for three years in a row (2008-2010) Recipient of HealthGrades' Stroke Care Excellence Award for five years in a row (2006-2010) Ranked Best in Virginia for GI Medical Treatment for two years in a row (2009-2010) Recipient of HealthGrades' Gastrointestinal Care Excellence Award for six years in a row (2005-2010)
Inova Fairfax Accomplishments • American Nurses Credentialing Center • Magnet Status since 1997 • First Magnet Hospital in DC region, • One of 102 nationally • US News and World Report • Top 50 hospitals for GYN, Urology, Heart and Heart Surgery
Inova Fairfax Accomplishments • Health and Human Services • Medal of Honor for Organ Donation • Joint Commission Disease Specific Certification • Primary Stroke Center • VAD (Ventricular Assist Device) • Transplant • American College of Surgeons • Level 1 Regional Trauma Center • Working Mother Magazine • Top 100 Employers