Download
1 / 30
360 likes | 1.06k Vues
The Consumer Theory . How Consumers Make Choices under Income Constraints . Some Questions . What is behind a consumer’s demand curve? How do consumers choose from among various consumer “goods”? What determines the value of a consumer good? . Utility .

E N D
The Consumer Theory How Consumers Make Choices under Income Constraints
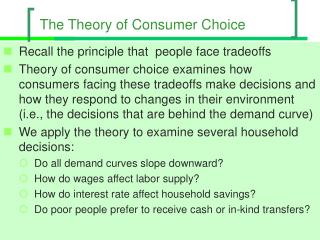
Some Questions • What is behind a consumer’s demand curve? • How do consumers choose from among various consumer “goods”? • What determines the value of a consumer good?
Utility • The value a consumer places on a unit of a good or service depends on the pleasure or satisfaction he or she expects to derive form having or consuming it at the point of making a consumption (consumer) choice. • In economics the satisfaction or pleasure consumers derive from the consumption of consumer goods is called “utility”. • Consumers, however, cannot have every thing they wish to have. Consumers’ choices are constrained by their incomes. • Within the limits of their incomes, consumers make their consumption choices by evaluating and comparing consumer goods with regard to their “utilities.”
Our basic assumptions about a “rational” consumer: • Consumers are utility maximizers • Consumers prefer more of a good (thing) to less of it. • Facing choices X and Y, a consumer would either prefer X to Y or Y to X, or would be indifferent between them. • Transitivity: If a consumer prefers X to Y and Y to Z, we conclude he/she prefers X to Z • Diminishing marginal utility: As more and more of good is consumed by a consumer, ceteris paribus, beyond a certain point the utility of each additional unit starts to fall.
How to Measure Utility Measuring utility in “utils” (Cardinal): • Jack derives 10 utils from having one slice of pizza but only 5 utils from having a burger. • In many introductory microeconomics textbooks this approach to measuring utility is still considered effective for teaching purposes. Measuring utility by comparison (Ordinal): • Jill prefers a burger to a slice of pizza and a slice of pizza to a hotdog. Often consumers are able to be more precise in expressing their preferences. For example, we could say: • Jill is willing to trade a burger for four hotdogs but she will give up only two hotdogs for a slice of pizza. • We can infer that to Jill, a burger has twice as much utility as a slice of pizza, and a slice of pizza has twice as much utility as a hotdog.
Utility and Money • Because we use money (rather than hotdogs!) in just about all of our trade transactions, we might as well use it as our comparative measure of utility. (Note: This way of measuring utility is not much different from measuring utility in utils) • Jill could say: I am willing to pay $4 for a burger, $2 for a slice of pizza and $1 for a hotdog. Note: Even though Jill obviously values a burger more (four times as much) than a hot dog, she may still choose to buy a hotdog, even if she has enough money to buy a burger, or a slice of pizza, for that matter. (We will see why and how shortly.)
Total Utility versus Marginal Utility • Marginal utility is the utility a consumer derives from the last unit of a consumer good she or he consumes (during a given consumption period), ceteris paribus. • Total utility is the total utility a consumer derives from the consumption of all of the units of a good or a combination of goods over a given consumption period, ceteris paribus. Total utility = Sum of marginal utilities
The Law of Diminishing Marginal Utility • Over a given consumption period, the more of a good a consumer has, or has consumed, the less marginal utility an additional unit contributes to his or her overall satisfaction (total utility). • Alternatively, we could say: over a given consumption period, as more and more of a good is consumed by a consumer, beyond a certain point, the marginal utility of additional units begins to fall.
How much ice cream does Jill buy in a month? Some facts of life: • Limited income • Opportunity cost of making a choice: Buying ice cream leaves Jill less money to buy other things: each dollar spent on ice cream could be spent on hamburger. • In fact, consumers compare the (expected) utility derived from one additional dollar spent on one good to the utility derived from one additional dollar spent on another good.
More facts • The prices of hamburger and ice cream are market-given; the consumer cannot change the price of a good. • Jill, like any other rational consumer, wishes to maximize her utility. • The opportunity cost of one dollar spent on ice cream is the forgone utility of one dollar that could be on hamburger. • If the utility of one additional dollar of ice cream is greater than the utility of the last dollar spent on hamburger, Jill can increase her total utility by spending one dollar less on hamburger and one dollar more one ice cream.
Hamburger or Hotdog • If based on their perceived marginal utilities Jill values a hamburger four times as much as a hotdog, but the market price of a burger is eight times the price of a hotdog, she will buy a hotdog. That is because one dollar’s worth of hotdogs would give her more utility that one dollar’s worth of burgers. That is: MUD/PD > MUH/PH
Utility Maximizing Rules • A rational consumer would buy an additional unit of a good as long as the perceived dollar value of the utility of one additional unit of that good (say, its marginal dollar utility) is greater than its market price. • The Two-Good Rule MUI MUH --------- = ---------- $PI $PH
Utility Maximization under An Income constraint • Consumers’ spending on consumer goods is constrained by their incomes: Income = Px Qx + Py Qy + Pw Ow + ….+Pz Qz • While the consumer tries to equalize MUx/Px , MUy/ Py, MUw/Pw,………. and MUz/Pz , to maximize her utility her total spending cannot exceed her income. For example, with an and income of $86 Jill is trying to decide how much ice cream and how much hamburger she should buy. Jill’s income = 5x10 + 6 x 6 = 86
The Budget Line Income = QI.PI + QH.PH = (5 x 10)+(6 x 6) = 86 Ice Cream 86/10 Slope = PH/PI = 6/10 = 8.6/14.33 = 0.6 8.6 5 86/6 Hamburger o 6 14.33
An Optimal Change Recall that to maximize utility a consumer would set: (MUx/Px) = (MUy/Py) If Px increases this equality would be disturbed: (MUx/Px) < (MUy/Py) To return to equality the consumer must adjust his/her consumption. (Have in mind that the consumer cannot change prices, and he/she has an income constraint.) What are the consumer’s options?
(MUx/Px) < (MUy/Py) In order to make the two sides of the above inequality equal again, given that Px and Py could not be changed, we would have to increase MUx and decrease MUy. Recalling the law of diminishing marginal utility, we can increase MUx by reducing X and decrease MUy by increasing Y.
Price and the Shape of the Demand Curve The two effects of a price change: • Income effect: Normal good (-) Inferior goods (+) • Substitution effect Buying less X and substituting it with Y until the optimizing condition is restored (-) As Px increases, Qx decreases
Consumer Surplus • The difference between what a consumer is willing to pay for an addition unit of a good and the market price that he/she actually pays is referred to as “consumer surplus”. • The area between the demand curve and the price (line) measures the total consumer surplus.
Consumer Surplus P Price D Qx 0
Consumer Surplus P Price P’ D D’ Qx 0
An Alternative Approach to the Consumer Theory • Indifference curves An indifference curve is a line drawn in a two-dimensional space showing different combinations of two goods from which the consumer draws the same amount of utility and therefore he/she is “indifferent” about. • Budget lines A budget line is a line drawn in a two-dimensional space representing a certain level of income with which the consumer can purchase various combinations of two goods at given prices.
Properties of Indifference curves • Indifference curves for two “goods” are generally negatively sloped • The slope of an indifference curve reflects the degree of substitutability of two goods for one another • Indifference curves are generally convex, reflecting the principle of diminishing returns • Indifference curves never cross • Indifference curves that are farther from the origin represent higher levels of utility • Indifference curves for a “good” and a “bad” are positively sloped
Indifference Curves Y Slope = Change in Y/Change in X = MUx/MUy U4 U3 U2 U1 X O
Budget Line Y Income = Px .Qx + Py. Qy I/Py Slope = Px/Py X O I/Px
Indifference Curves Y MRS = MUx/MUy= Px/Py a b c U4 U3 d U2 e U1 X O
A change in the price of X: Income and substitution effects Y a b U5 C’ Y1 c Yo U4 c” U3 d U2 e U1 X O Xo X1
A change in the price of X: Income and substitution effects Y a b C’ U5 Y1 c U4 Yo c” U3 d U2 e U1 X O Xo X1