Multiple Indicator Growth Models aka, 2 nd Order Growth Daniel E Bontempo Scott M. Hofer
Multiple Indicator Growth Models aka, 2 nd Order Growth Daniel E Bontempo Scott M. Hofer. Acknowledgements. Funded in part by Grant R13AG030995-01A1 from the National Institute on Aging

Multiple Indicator Growth Models aka, 2 nd Order Growth Daniel E Bontempo Scott M. Hofer
E N D
Presentation Transcript
Multiple Indicator Growth Models aka, 2nd Order GrowthDaniel E BontempoScott M. Hofer
Acknowledgements • Funded in part by Grant R13AG030995-01A1 from the National Institute on Aging • The views expressed in written conference materials or publications and by speakers and moderators do not necessarily reflect the official policies of the Department of Health and Human Services; nor does mention by trade names, commercial practices, or organizations imply endorsement by the U.S. Government. Friday Harbor Psychometrics Workshop 2010
Modeling Processes of Change • As with Growth Modeling (GM) and Latent Growth Modeling (LGM), the goal remains to model overall pattern of within-person change, between person differences in change trajectories, and covariates that predict these fixed patterns and individual differences • This goal is facilitated by: • Reliability of measurements • Magnitude of systematic within-person variation • Number of measurement occasions
Multiple Indicator Growth Models • Reliability is greater when growth modeling is based on an explicit measurement model that attenuated for measurement error • Separation of reliable time-specific variance and measurement error variance • Increased power for growth model parameters (i.e., smaller standard errors)
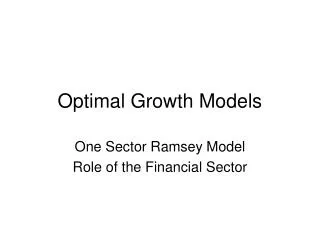
Factor Models vs Latent Growth Modelsvs 2nd Order Latent Growth Each model has two latent factors Growth model has fewer indicators because the latent growth factors cross load In the factor model the loadings are estimated to get the best factor In the LGB the loadings ares specified to get a GF corresponding to a specific pattern f growth
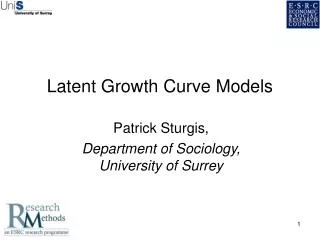
2ndOrder Factor vs 2nd Order Growth • The only difference is in the loadings at the 2nd level
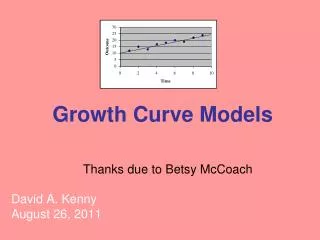
F R M But WAIT! - Is the indicator reflective?The Nature and Direction of Relationships Between Constructs and Measures: Reflective vs Formative Edwards, J. R., & Bagozzi, R. P. (2000). On the nature and direction of relationships between constructs and measures. Psychological Methods, 5(2), 155-174.
R-F Importance • One vs multiple error terms • Error in latent construct • Misspecification can greatly bias estimation of structural parameters • MacKenzie, S. B., Podsakoff, P. M., & Jarvis, C. B. (2005). The Problem of Measurement Model Misspecification in Behavioral and Organizational Research and Some Recommended Solutions. Journal of Applied Psychology, 90(4), 710-730.
R-F in Practice • In 1990, a survey of 15 articles using latent variables published in 1985-1986 in key social science journals, found constructs such as stressful life events, life change, illness, and instrumental activity of daily living inappropriately specified as reflective constructs. • Cohen, P., Cohen, J., Teresi, J., Marchi, M. L., & et al. (1990). Problems in the measurement of latent variables in structural equations causal models. Applied Psychological Measurement, 14(2), 183-196. • Still in 2005, another study finds important constructs in organizational and behavior research to be commonly mis-specified as reflective. • MacKenzie, S. B., Podsakoff, P. M., & Jarvis, C. B. (2005). The Problem of Measurement Model Misspecification in Behavioral and Organizational Research and Some Recommended Solutions. Journal of Applied Psychology, 90(4), 710-730.
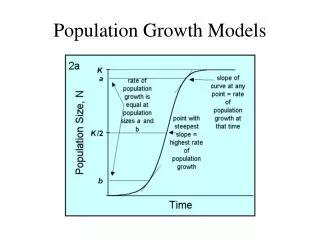
Formative Presence/severity of cerebrovascular disease Presence/severity of cardiovasuclar disease Presence/severity of muscular-skeletal disease Presence/severity of cancer & immune system related problems Reflective (functional) Pain severity/persistence Energy level Fatigue-proneness Activity limitation Example: Activity-Limiting Illness
Classical Test Theory • T(rue score) is a hypothetical average of an infinite number of scores • Xi = T + ei • Systematic errors in X become part of T • ξ is not an average, but a latent variable that corresponds to a construct • X i = λiξ + δi • Relation betweenξ and X i can vary • δi contains random error and systematic variance
Optimizing Analysis of Change with Multiple Indicator Models • Latent factor growth models will improve precision of growth model parameters by disattenuating for occasion-specific measurement error • Requirements • Multiple indicators of a common factor at each occasion • Item-level data • Alternative tests (i.e. scales) • Multiple methods/raters • Evidence for Strong Factorial Invariance across occasions • Other evidence of measurement equivalence for formative indicators
Ordinal adds an “order” or two that may not count • The manifest Xs have several latent y’s asociated with each X • Not really a factor order
Evidence for measurement invariance involves a nested sequence of increasingly stringent tests (Meredith,1993; Meredith & Horn, 2001). Configural (Baseline) – intercepts, loadings, & uniquenesses are freely estimated across groups, with minimal constraints only for identification Weak – constrain factor-variable regressions (i.e., loadings): factor variance in common metric Strong – constrain intercepts: factor means in common metric Strict – constrain uniquenesses (i.e., residuals): manifest scores comparable Hierarchy of FI Tests
Factor Analytic Measurement Parameters • A regression like relationship with an intercept, slope, and residual. • Intercepts • Loadings • Uniquenesses Invariance entails comparable parameters across groups.
Weak Factorial Invariance • Equality constraints on the factor-variable regressions (i.e., factor loadings) across groups while ensuring the factor variances and covariances are free to vary • This condition is minimally necessary for establishing evidence for invariant measurement operations (Horn, 1991; Horn, McArdle, & Mason, 1983; Meredith, 1964; 1993)
Strong Factorial Invariance • Additional constraint of invariant mean intercepts across groups and fixed reference group factor mean • Permits differences in means to be expressed at the factor level • Factor mean differences across groups/time are expressed as differences relative a reference group or occasion • Factor means for reference group/occasion are set to zero or some arbitrary value (Sorbom, 1974; see also Horn & McArdle, 1992)
Strict Factorial Invariance • Additional constraint of invariant unique variances as well as unique means and factor loadings • Test of differences in magnitude of specific (i.e., unique systematic + error) variance • This model forces the combined specific and random error components of corresponding variables to be equivalent across groups such that differences in variances across groups are permitted only at the latent variable level
Evaluating Factorial Invariance • Configural • Same pattern of factor loadings • Weak (“Metric”) Factorial Invariance • Factor loadings equal • Strong Factorial Invariance • Factor loadings equal • Mean intercepts equal • Strict Factorial Invariance • Factor loadings equal • Mean intercepts equal • Unique variances equal
LGC Factor-Level Specification 1. Strong or Strict Factorial Invariance established • Factor-variable regressions and variable intercepts constrained to be equal, Reference occasion factor mean and variance fixed to 0.0 and 1.0, respectively 2. Factor-level covariances and means are fixed to zero 3. Metric for LGC parameters is identified by either of two approaches • Reference Occasion: LGC Level mean = 0; variance=1 • Corresponding manifest intercepts equal • Manifest Variable: LGC Level mean and variance estimated • Fixed factor loading • Reference variable intercept (all occasions) = 0 (provides factor metric) • All other corresponding manifest intercepts estimated but equal
Scaling of Growth Factors • Ferrer, Balluerka, & Widaman (2009) Methodology • Recommend an “approximately standardized metric” at first occasion of measurement • Change is expressed in Cohen’s d metric • Standard deviation units based on T1 between-person differences
Ferrer et al. Specification of the LGC model of factor outcomes • Begin with the Strong or Strict FI model (standardized reference factor metric) • Fix the mean of the LGC intercept to 0. • Fix the reference variable factor loading to the value obtained in the strong or strict FI analysis. • Estimate the factor variances at each occasion. • Fix the factor means at each occasion to 0.
Advantages of Modeling Factors in LGC • Separates reliable common and specific variance from error variance • Evaluation of measurement comparability over time • Reduces bias of time-specific systematic variance and measurement error • Increases power for growth factor parameters (smaller standard error) • Disattenuates time-specific residuals for within-person analysis