Download
1 / 18
180 likes | 218 Vues
Eunomia Local data for Street Cleansing Nov 2018

E N D
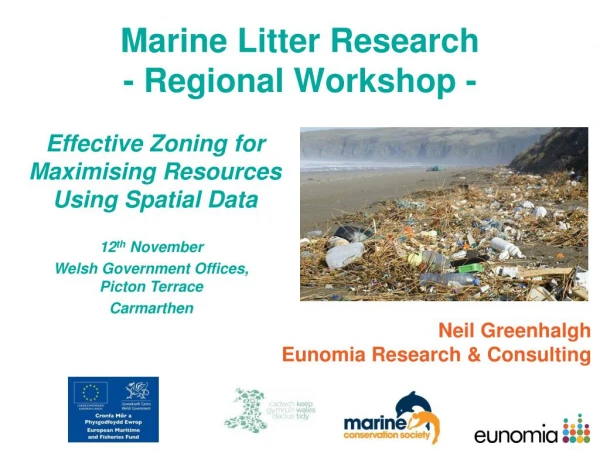
Marine Litter Research - Regional Workshop - Effective Zoning for Maximising Resources Using Spatial Data 12th November Welsh Government Offices, Picton Terrace Carmarthen Neil GreenhalghEunomia Research & Consulting
Agenda • A few facts & figures • Street cleaning – Cinderella service • Challenges • The EPA and Code of Practice • Zoning and spatial data • How can it improve performance? • Wider implications
Key Facts About Litter • Almost a billion pounds per year in the UK • Only 3.3% of streets in Wales are completely litter free • Chewing gum litter can be found on 74.7% of Wales’ streets • It takes 15 years for a cigarette end to biodegrade • 80% of beach litter comes from the land • 90% of LA’s in Wales said plastic drinks bottles were a major problem and 85% cited fast food packaging • 50% of the Welsh population admit to littering • Wales has almost 34,000 km of highway • Estimated 25,000+ litter/dog bins in Wales *Source KWT (Fact Sheet)
Cinderella Service • The service that people don’t always see • Operates virtually every day of the year • Taken for granted • Service priorities - diverting resources to refuse, flooding etc. • Wider risks of environmental degradation • Fast food outlets on the rise • Plastics high on the public agenda • Avoidable problem
Challenges • Getting the public to stop littering (education / awareness / enforcement) • How much investment can we afford? • How do you know what interventions are successful? • How do you measure performance & what tools are available? • Funding pressures (40% cut in five years) • What is the next plastic litter? • How long will the Blue Planet impact last?
The Impact of Street Cleansing • “The quality of the local environment, that is, the appearance of an area, and the way that people perceive it, comes down to good, effective management.” Quote: COPLAR 2007
EPA & Code of Practice 2007 • “Betterstandardscan be achieved within the existing levels of expenditure by deploying suitable resources at appropriate times and combining this with education and enforcement.” • “All duty bodies in an area should consult together and develop an integrated approach to zoning. This should be led by the Principal Litter Authority” • “Duty bodies are expected to publish details of these zones for their land and make them available to the public on request.”
Zones & Response Times • High intensity - 1/2 a day • (This means by 6pm if reported before 1pm or by 1pm the next duty day if reported between 1pm and 6pm on the previous day) • Medium intensity – 1 day • (This means by 6pm the following evening) • Low intensity – 14 days • Special circumstances - 28 days or as soon as reasonably practicable
High Intensity of Use • Areas which, through intense pedestrian and/or vehicular movements, are prone to fluctuations in litter and refuse and require both high levels of monitoring and frequent cleansing • Parks and open spaces located in busy public areas, or with strategic national importance, or parts of other open spaces subject to high intensity of use
Medium Intensity of Use • Areas affected by moderate levels of pedestrian and vehicular activity and therefore less prone to fluctuations in litter and refuse, usually situated outside centres of retail or commercial activity, but used regularly by members of the public • Parks and open spaces located in areas as described above, or parts of other open spaces subject to medium intensity of use
Low Intensity of Use • Areas subject to low or infrequent levels of pedestrian and vehicular activity and therefore less prone to fluctuations in litter and refuse, often located in more rural areas • Parks and open spaces located in areas as described above, or parts of other open spaces subject to low intensity of use
Zoning Process • Enables mapping onto GIS • Interactive exercise • Utilises whole team approach and local knowledge • Identifies litter bins, depots, disposal facilities etc. • Spatial identification of hot-spots • Fly-tipping incidents • Litter problem areas • Clustering of resources
Advantages of Zoning • GIS mapping commonly used by most local authorities • Publicly accessible • Records hotspots • Concentrates resources in areas of greatest need • Reduces reactive work • Allows flexibility for change • More planned routing than reactive • Reduces cleaning a clean street! • Is one of many tools
Spatial Information • Strategic overview • Increase flexibility • More holistic view of service • Identify patterns and changes • Links spatial performance monitoring • Heat maps • Identifies assets • Review hotspots • Challenge resource allocation
Wider Implications • Cause and effect • Links with LEAMS • Link with waste policies • Recognising impacts down stream • Links with river and coastal network • Type of waste, source of waste and how to tackle these in a preventative way • Strategic links with other Principal Litter Authorities
Thank you • Please take your litter home!
Neil Greenhalgh Local Government Specialist Tel: 0117 917 2250 neil.greenhalgh@eunomia.co.uk


![liacs [HW] Nov 2018](https://cdn5.slideserve.com/9550954/liacs-hw-nov-2018-dt.jpg)