Download
1 / 9
90 likes | 109 Vues
Worldwide Bioplastic Packaging Business Sector to Achieve USD 34.24 Billion by 2024

E N D
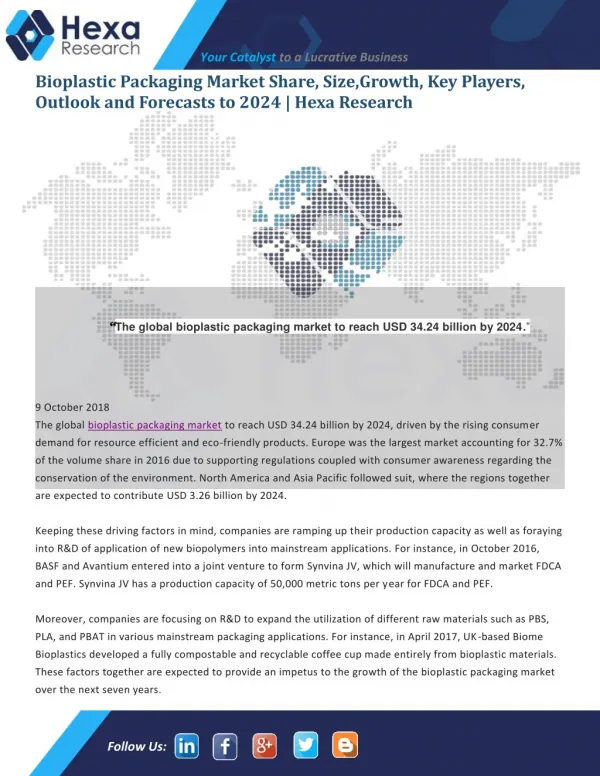
Your CatalystTo a Lucrative Business Bioplastic Packaging Market Research Report - Industry Analysis, Size, Share and Forecast to 2024 - Hexa Research The Global Bioplastic Packaging Market to reach USD 34.24 billion by 2024, driven by the rising consumer demand for resource efficient and eco-friendly products. Europe was the largest market accounting for 32.7% of the volume share in 2016 due to supporting regulations coupled with consumer awareness regarding the conservation of the environment. North America and Asia Pacific followed suit, where the regions together are expected to contribute USD 3.26 billion by 2024. Keeping these driving factors in mind, companies are ramping up their production capacity as well as foraying into R&D of application of new biopolymers into mainstream applications. For instance, in October 2016, BASF and Avantium entered into a joint venture to form Synvina JV, which will manufacture and market FDCA and PEF. Synvina JV has a production capacity of 50,000 metric tons per year for FDCA and PEF. Moreover, companies are focusing on R&D to expand the utilization of different raw materials such as PBS, PLA, and PBAT in various mainstream packaging applications. For instance, in April 2017, UK-based Biome Bioplastics developed a fully compostable and recyclable coffee cup made entirely from bioplastic materials. These factors together are expected to provide an impetus to the growth of the bioplastic packaging market over the next seven years. “Global Bioplastic Packaging Market is expected to witness significant growth on account of rising consumer awareness regarding the harmful effects of synthetic plastics on the ecology.” Follow Us:
Your CatalystTo a Lucrative Business Browse Details of Report@https://www.hexaresearch.com/research-report/bioplastic-packaging-market PET dominated the global market contributing to USD 1.84 billion in 2016. The polymer was extensively used in rigid packaging on account of its high durability, transparency, and ease of moldability. Initiatives undertaken by companies such as Coca-Cola, P&G, and Heinz to use bio-based materials for packing beverages, sauces & spreads and cosmetics is expected to bolster the growth of the rigid packaging market. Increasing demand for flexible packaging solutions on account of several benefits including size and weight particularly in food applications coupled with rising demand for biodegradable films is anticipated to boost the growth of the market. The segment is expected to grow at a volume CAGR of 20.6% from 2017 to 2024. Food packaging accounted for 9% of the overall market share in 2016 and is likely to witness above average growth as a result of rising consumer requirement for eco-friendly packaging. Aesthetic attributes such as transparency, size, weight and presentation are expected to drive the growth of the segment over the projected period. The growth of the global bioplastic packaging industry driven primarily by consumer demand is also likely to be favored by the implementation of stringent regulations for its synthetic counterparts. Despite the fall in crude oil prices, companies such as BASF, Arkema Dow, Solvay, and Braskem are continuing production at their facilities and focusing on R&D. These factors are likely to result in a tremendous growth of the global bioplastic packaging market growing at a revenue CAGR of 28.3% over the next seven years. Hexa Research has segmented the global bioplastic packaging market on the basis of raw material, product, application and region: Segmentation by raw material, 2014 - 2024 (Kilo Tons) (USD Million) • Polyethylene terephthalate (PET) • Polyethylene (PE) • Other non-biodegradable polymers • Polybutyrate (PBAT) • Polybutylene succinate (PBS) • Polylactic acid (PLA) • Polyhydroxyalkanoates (PHA) • Starch blends Segmentation by product, 2014 - 2024 (Kilo Tons) (USD Million) • Rigid • Flexible Segmentation by application, 2014 - 2024 (Kilo Tons) (USD Million) • Plastic bottles • Food packaging • Others Segmentation by region, 2014 - 2024 (Kilo Tons) (USD Million) • North America • U.S. • Europe Follow Us:
Your CatalystTo a Lucrative Business • Germany • UK • Asia Pacific • China • Central & South America • Brazil • MEA Key players analyzed: • Arkema Inc. • BASF SE • The Dow Chemical Company • Novamont • Corbion • Solvay • Toray • Braskem • NatureWorks, LLC • Royal DSM N.V. Browse Related Category Market Reports @ https://www.hexaresearch.com/research-category/renewable- chemicals-industry Follow Us:
Your CatalystTo a Lucrative Business Table of Content of Bioplastic Packaging Market Chapter 1. Market Summary 1.1. Market trends & movement Chapter 2. Bioplastic Packaging Market Trends: Drivers & Opportunities 2.1. Introduction 2.2. Key industry trends 2.3. Market drivers 2.4. Market restraints 2.5. Value chain analysis 2.6. Porter's Five Forces analysis 2.7. SWOT 2.8. Routes for manufacturing bioplastic packaging products 2.9. Regulatory framework Chapter 3. Bioplastic Packaging Market Trends, By Raw Material 3.1. Global bioplastic packaging market movement, by raw material, 2016 & 2025 3.1.1. Polyethylene terephthalate (PET) 3.1.1.1. Market estimates and forecast, 2014 – 2025 (Kilo Tons) (USD Million) 3.1.2. Polyethylene (PE) 3.1.2.1. Market estimates and forecast, 2014 – 2025 (Kilo Tons) (USD Million) 3.1.3. Other non-biodegradable 3.1.3.1. Market estimates and forecast, 2014 – 2025 (Kilo Tons) (USD Million) 3.1.4. Polybutyrate (PBAT) 3.1.4.1. Market estimates and forecast, 2014 – 2025 (Kilo Tons) (USD Million) 3.1.5. Polybutylene succinate (PBS) 3.1.5.1. Market estimates and forecast, 2014 – 2025 (Kilo Tons) (USD Million) 3.1.6. Polylactic acid (PLA) 3.1.6.1. Market estimates and forecast, 2014 – 2025 (Kilo Tons) (USD Million) 3.1.7. Polyhydroxyalkanoates (PHA) 3.1.7.1. Market estimates and forecast, 2014 – 2025 (Kilo Tons) (USD Million) 3.1.8. Starch blends 3.1.8.1. Market estimates and forecast, 2014 – 2025 (Kilo Tons) (USD Million) Chapter 4. Bioplastic Packaging Market Trends, By Product 4.1. Global bioplastic packaging market movement, by product, 2016 & 2025 4.1.1. Rigid Follow Us:
Your CatalystTo a Lucrative Business 4.1.1.1. Market estimates and forecast, 2014 – 2025 (Kilo Tons) (USD Million) 4.1.2. Flexible 4.1.2.1. Market estimates and forecast, 2014 – 2025 (Kilo Tons) (USD Million) Chapter 5. Bioplastic Packaging Market Trends, By Application 5.1. Global bioplastic packaging market movement, by application, 2016 & 2025 5.1.1. Plastic bottle 5.1.1.1. Market estimates and forecast, 2014 – 2025 (Kilo Tons) (USD Million) 5.1.2. Food packaging 5.1.2.1. Market estimates and forecast, 2014 – 2025 (Kilo Tons) (USD Million) 5.1.3. Others 5.1.3.1. Market estimates and forecast, 2014 – 2025 (Kilo Tons) (USD Million) Chapter 6. Bioplastic Packaging Market Trends, By Region 6.1. Global bioplastic packaging market movement, by region, 2014 & 2025 6.1.1. North America 6.1.1.1. Market estimates and forecast, 2014 – 2025 (Kilo Tons) (USD Million) 6.1.1.2. Market estimates and forecast, by raw material, 2014 – 2025 (Kilo Tons) (USD Million) 6.1.1.3. Market estimates and forecast, by product, 2014 – 2025 (Kilo Tons) (USD Million) 6.1.1.4. Market estimates and forecast, by application, 2014 – 2025 (Kilo Tons) (USD Million) 6.1.2. Europe 6.1.2.1. Market estimates and forecast, 2014 – 2025 (Kilo Tons) (USD Million) 6.1.2.2. Market estimates and forecast, by raw material, 2014 – 2025 (Kilo Tons) (USD Million) 6.1.2.3. Market estimates and forecast, by product, 2014 – 2025 (Kilo Tons) (USD Million) 6.1.2.4. Market estimates and forecast, by application, 2014 – 2025 (Kilo Tons) (USD Million) 6.1.3. Asia Pacific 6.1.3.1. Market estimates and forecast, 2014 – 2025 (Kilo Tons) (USD Million) 6.1.3.2. Market estimates and forecast, by raw material, 2014 – 2025 (Kilo Tons) (USD Million) 6.1.3.3. Market estimates and forecast, by product, 2014 – 2025 (Kilo Tons) (USD Million) 6.1.3.4. Market estimates and forecast, by application, 2014 – 2025 (Kilo Tons) (USD Million) 6.1.4. Central & South America 6.1.4.1. Market estimates and forecast, 2014 – 2025 (Kilo Tons) (USD Million) 6.1.4.2. Market estimates and forecast, by raw material, 2014 – 2025 (Kilo Tons) (USD Million) 6.1.4.3. Market estimates and forecast, by product, 2014 – 2025 (Kilo Tons) (USD Million) 6.1.4.4. Market estimates and forecast, by application, 2014 – 2025 (Kilo Tons) (USD Million) 6.1.5. MEA 6.1.5.1. Market estimates and forecast, 2014 – 2025 (Kilo Tons) (USD Million) 6.1.5.2. Market estimates and forecast, by raw material, 2014 – 2025 (Kilo Tons) (USD Million) Follow Us:
Your CatalystTo a Lucrative Business 6.1.5.3. Market estimates and forecast, by product, 2014 – 2025 (Kilo Tons) (USD Million) 6.1.5.4. Market estimates and forecast, by application, 2014 – 2025 (Kilo Tons) (USD Million) Chapter 7. Key Country Markets 7.1. U.S. 7.1.1. Market estimates and forecast, 2014 – 2025 (Kilo Tons) (USD Million) 7.1.2. Market estimates and forecast, by raw material, 2014 – 2025 (Kilo Tons) (USD Million) 7.1.3. Market estimates and forecast, by product, 2014 – 2025 (Kilo Tons) (USD Million) 7.1.4. Market estimates and forecast, by application, 2014 – 2025 (Kilo Tons) (USD Million) 7.2. Germany 7.2.1. Market estimates and forecast, 2014 – 2025 (Kilo Tons) (USD Million) 7.2.2. Market estimates and forecast, by raw material, 2014 – 2025 (Kilo Tons) (USD Million) 7.2.3. Market estimates and forecast, by product, 2014 – 2025 (Kilo Tons) (USD Million) 7.2.4. Market estimates and forecast, by application, 2014 – 2025 (Kilo Tons) (USD Million) 7.3. UK 7.3.1. Market estimates and forecast, 2014 – 2025 (Kilo Tons) (USD Million) 7.3.2. Market estimates and forecast, by raw material, 2014 – 2025 (Kilo Tons) (USD Million) 7.3.3. Market estimates and forecast, by product, 2014 – 2025 (Kilo Tons) (USD Million) 7.3.4. Market estimates and forecast, by application, 2014 – 2025 (Kilo Tons) (USD Million) 7.4. China 7.4.1. Market estimates and forecast, 2014 – 2025 (Kilo Tons) (USD Million) 7.4.2. Market estimates and forecast, by raw material, 2014 – 2025 (Kilo Tons) (USD Million) 7.4.3. Market estimates and forecast, by product, 2014 – 2025 (Kilo Tons) (USD Million) 7.4.4. Market estimates and forecast, by application, 2014 – 2025 (Kilo Tons) (USD Million) 7.5. Brazil 7.5.1. Market estimates and forecast, 2014 – 2025 (Kilo Tons) (USD Million) 7.5.2. Market estimates and forecast, by raw material, 2014 – 2025 (Kilo Tons) (USD Million) 7.5.3. Market estimates and forecast, by product, 2014 – 2025 (Kilo Tons) (USD Million) 7.5.4. Market estimates and forecast, by application, 2014 – 2025 (Kilo Tons) (USD Million) Chapter 8. Competitive Landscape 8.1. Competitive landscape analysis, 2016 8.2. Strategic framework 8.3. Potential customer base concentration 8.4. Company market positioning 8.5. Company profiles 8.5.1. Arkema Inc. 8.5.1.1. Company Overview Follow Us:
Your CatalystTo a Lucrative Business 8.5.1.2. Product Benchmarking 8.5.1.3. Financial Performance 8.5.1.4. Recent Initiatives 8.5.2. BASF SE 8.5.2.1. Company Overview 8.5.2.2. Product Benchmarking 8.5.2.3. Financial Performance 8.5.2.4. Recent Initiatives 8.5.3. The DOW Chemical Company 8.5.3.1. Company Overview 8.5.3.2. Product Benchmarking 8.5.3.3. Financial Performance 8.5.3.4. Recent Initiatives 8.5.4. Novamont 8.5.4.1. Company Overview 8.5.4.2. Product Benchmarking 8.5.4.3. Financial Performance 8.5.4.4. Recent Initiatives 8.5.5. Corbion 8.5.5.1. Company Overview 8.5.5.2. Product Benchmarking 8.5.5.3. Financial Performance 8.5.5.4. Recent Initiatives 8.5.6. Solvay 8.5.6.1. Company Overview 8.5.6.2. Product Benchmarking 8.5.6.3. Financial Performance 8.5.6.4. Recent Initiatives 8.5.7. Toray 8.5.7.1. Company Overview 8.5.7.2. Product Benchmarking 8.5.7.3. Financial Performance 8.5.7.4. Recent Initiatives 8.5.8. Braskem 8.5.8.1. Company Overview 8.5.8.2. Product Benchmarking Follow Us:
Your CatalystTo a Lucrative Business 8.5.8.3. Financial Performance 8.5.8.4. Recent Initiatives 8.5.9. NatureWorks, LLC 8.5.9.1. Company Overview 8.5.9.2. Product Benchmarking 8.5.9.3. Financial Performance 8.5.9.4. Recent Initiatives 8.5.10. Royal DSM N.V. 8.5.10.1. Company Overview 8.5.10.2. Product Benchmarking 8.5.10.3. Financial Performance 8.5.10.4. Recent Initiatives 8.5.11. List of other vendors Chapter 9. Methodology and Scope 9.1. Research methodology 9.2. Research Scope & Assumptions 9.3. List of data sources Follow Us:
Your CatalystTo a Lucrative Business About Us: Hexa Research is a market research and consulting organization, offering industry reports, custom research and consulting services to a host of key industries across the globe. We offer comprehensive business intelligence in the form of industry reports which help our clients obtain clarity about their business environment and enable them to undertake strategic growth initiatives. Contact Us: Ryan Shaw Hexa Research Felton Office Plaza 6265 Highway 9 Felton, California 95018 United States Phone: +1-800-489-3075 Email: sales@hexaresearch.com Website - http://www.hexaresearch.com/ Follow Us: