Main Ideas
Lesson #20b. ~ Small Sample Test for a Mean ~. Assumptions Use of t-distribution as reference distribution Relationship to confidence interval. Main Ideas. 1. 1. Assumptions A random sample is taken from a population with mean m and standard deviation s .

Main Ideas
E N D
Presentation Transcript
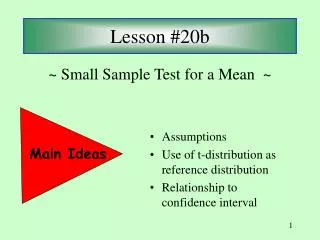
Lesson #20b ~ Small Sample Test for a Mean ~ • Assumptions • Use of t-distribution as reference distribution • Relationship to confidence interval Main Ideas 1
1. Assumptions • A random sample is taken from a population with mean m and standard deviation s. • The population has a normal distribution. • The sample size may be small or large, but the technique was developed especially for small sample sizes. • We are interested in testing the same types of hypotheses about m we did in the large sample case. 2
2. Test Statistic for a Mean • The test statistic has the form • This behaves as a t random variable with n - 1 degrees of freedom if H0 is true. • Values of t “too large” or “two small” indicate that the alternative hypothesis is true. 3
3. Critical region for two-sided test, level of significance .05, sample size n = 10, d.f. = 9 If t falls here, reject H0 If t falls here, reject H0 - 2.262 2.262 If t falls here, accept H0 H0: m = m0, Ha: m not equal m0 4
Example #1. The average length of a certain jawbone measurement of a moose is 11.5 cm. Jawbone measurements of 10 samples from an unknown species are examined to see if they are consistent with that of the moose. The data are: 14.0, 15.1, 13.6, 12.9, 11.0, 12.5, 14.9, 9.6, 15.0, 14.2 mean = 13.28, s.d. = 1.82, n = 10, m0 = 11.5 test statistic: t = (13.28 - 11.5)/[1.82/sqrt(10)] = 3.09 Since 3.09 > 2.262, we conclude that the mean length of the jawbones of the unknown species are not consistent with that of the moose. 5
4. Relationship to Confidence Interval • It is possible to do a two-sided test of hypothesis using the confidence interval approach. • Make a confidence interval for the population mean. If the interval “captures” the hypothesized mean m0, then accept H0. If not, reject H0. 6
Example #2. Refer to the moose example. The sample mean is 13.28 and the sample standard deviation is 1.82. The 95% confidence interval for the mean is 13.28 2.262(1.82)/sqrt(10) or 11.98 to 14.58 Since the interval does not capture the hypothesized mean of 11.5, we conclude that the jawbones came from a population whose mean is different from that of the moose. 7
Is it better to do a hypothesis test or make a confidence interval? Most statisticians would agree that the confidence interval is more informative. However, research literature relies heavily on tests of hypotheses to summarize findings. Know both. 8