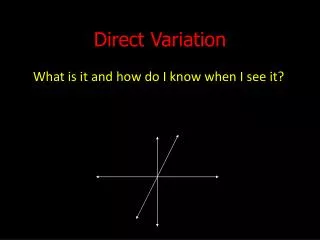
Direct Variation
Direct Variation. Constant of Proportionality. Warm Up. Brainstorm: List anything you notice about the table of data. Vocabulary. Constant of Proportionality - a constant ratio (unit rate) in any proportional relationship. Also known as: Looks like:.


Direct Variation
E N D
Presentation Transcript
Direct Variation Constant of Proportionality
Brainstorm: List anything you notice about the table of data.
Vocabulary Constant of Proportionality - a constant ratio (unit rate) in any proportional relationship. Also known as: Looks like:
Is this a proportional relationship?Is there a Constant of Proportionality?
Is this a proportional relationship?Is there a Constant of Proportionality?
Vocabulary Relationships that have a positive proportional relationship are said to have Direct Variation or Vary Directly Direct Variation– the ratio of output and input () is constant (proportional). The constant ratio is called the Constant of Proportionality
Which tables show a direct variation? Give the constant of proportionality, if possible.
Time to practice! • Determine if each relationship show Direct Variation • If possible, find the Constant of Proportionality • Complete the sentence interpret your answer.
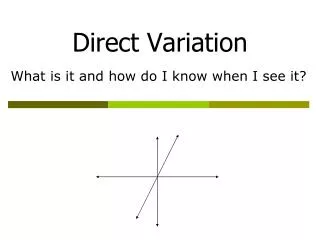
Brainstorm: • What does a relationship that is proportional look like on a graph? • How is the Constant of Proportionality (Unit Rate) involved?
Let’s see! Write each ratio as an ordered pair. Plot your ordered pairs. What do you notice?
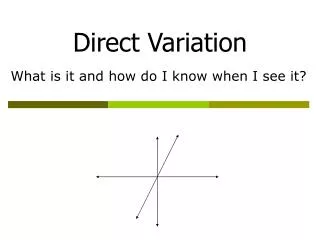
Summarize • What does a relationship that is proportional look like on a graph? • How is the Constant of Proportionality (Unit Rate) involved?
Time to practice! • Find the Constant of Proportionality on the following graphs. • Explain what it means in the context of the situation using a sentence.
Activity You will work with your group to solve the selected problems: - I will give you an index card with the selected problems. (You only complete the selected problems that I give you.) - Each group member will need to write their answers on their own paper 1. Complete the table if necessary, graph the points and tell whether or not the graph is proportional. 2. If there is no verbal description, you will need to create one - Try to write an equation for each scenario!
Pairing Up! You will find another group with has a different index card than you do! 1. When you meet up with the other group make sure to take your paper with you. 2. Whichever group had number 1, will go first. 3. This group will teach the other group how they did their problem. 4. You will take turns with the other group teaching until all 4 problems have been answered. 5. You will then independently fill out the other 2 problems in which you were taught.