Download
1 / 55
600 likes | 1.79k Vues
Standard Enthalpies of Formation. The standard enthalpy of formation of a substance, denoted D H f o , is the enthalpy change for the formation of one mole of a substance in its standard state from its component elements in their standard state.

E N D
Standard Enthalpies of Formation • The standard enthalpy of formation of a substance, denotedDHfo, is the enthalpy change for the formation of one mole of a substance in its standard state from its component elements in their standard state. • Note that the standard enthalpy of formation for a pure element in its standard state is zero.
Standard Enthalpies of Formation • The law of summation of heats of formation states that the enthalpy of a reaction is equal to the total formation energy of the products minus that of the reactants. • S is the mathematical symbol meaning “the sum of”, and m and n are the coefficients of the substances in the chemical equation.
A Problem to Consider • You record the values of DHfo under the formulas in the equation, multiplying them by the coefficients in the equation. • You can calculate DHo by subtracting the values for the reactants from the values for the products.
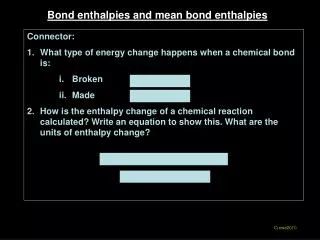
How is the heat of sublimation, Hsub, the enthalpy change for the reaction: H2O(s) H2O(g) related to Hfis andHvap?
Fuels • Food fills three needs of the body: • It supplies substances for the growth and repair of tissue. • It supplies substances for the synthesis of compounds used in the regulation of body processes. • It supplies energy. About 80% of the energy we need is for heat. The rest is used for muscular action and other body processes
Fuels • A typical carbohydrate food, glucose (C6H12O6) undergoes combustion according to the following equation. • One gram of glucose yields 15.6 kJ (3.73 kcal) when burned.
Fuels • A representative fat is glyceryl trimyristate, C45H86O6. The equation for its combustion is: • One gram of fat yields 38.5 kJ (9.20 kcal) when burned. Note that fat contains more than twice the fuel per gram than carbohydrates contain.
Figure 6.15: Sources of energy consumed in the United States (1996).
Fuels • Fossil fuels account for nearly 90% of the energy usage in the United States. • Anthracite, or hard coal, the oldest variety of coal, contains about 80% carbon. • Bituminous coal, a younger variety of coal, contains 45% to 65% carbon. • Fuel values of coal are measured in BTUs (British Thermal Units). • A typical value for coal is 13,200 BTU/lb. • 1 BTU = 1054 kJ
Fuels • Natural gas and petroleum account for nearly three-quarters of the fossil fuels consumed per year. • Purified natural gas is primarily methane, CH4, but also contains small quantities of ethane, C2H6, propane, C3H8, and butane, C4H10. • We would expect the fuel value of natural gas to be close to that for the combustion of methane.
This value of DHo is equivalent to 44.4 kJ/gram. Fuels • Petroleum is a very complicated mixture of compounds. • Gasoline, obtained from petroleum, contains many different hydrocarbons, one of which is octane, C8H18.
Fuels • With supplies of petroleum estimated to be 80% depleted by the year 2030, the gasification of coal has become a possible alternative. • First, coal is converted to carbon monoxide using steam. • The carbon monoxide can then be used to produce a variety of other fuels, such as methane.
States of Matter: Liquids and Solids Chapter 11
Exam Friday will cover Chapters 5 and 6 and as much of 11 as we finish tomorrow. Suggested Problems Chapter 11: 21, 23, 29, 34, 37, 39, 43, 45, 49, 51, 53, 55, 59, 61, 63, 67, 69, 71, 95, 97, 119 Online homework for Ch 5 and 6 due today
States of Matter • Comparison of gases, liquids, and solids. (see Figure 11.12) • Gases are compressible fluids. Their molecules are widely separated. • Liquids are relatively incompressible fluids. Their molecules are more tightly packed. • Solids are nearly incompressible and rigid. Their molecules or ions are in close contact and do not move.
Figure 11.2: Representation of the states of matter. Lattice energy
boiling condensation condensation or deposition sublimation (see Figure 11.3) freezing melting Changes of State • A change of state or phase transition is a change of a substance from one state to another. (see Table 11.1) gas liquid solid
Figure 11.3: A beaker containing iodine crystals.Photo courtesy of James Scherer.
Figure 11.3: Iodine has appreciable vapor pressure below its melting point. Photo courtesy of James Scherer.
Vapor Pressure • Liquids are continuously vaporizing. • If a liquid is in a closed vessel with space above it, a partial pressure of the vapor state builds up in this space. • The vapor pressure of a liquid is the partial pressure of the vapor over the liquid, measured at equilibrium at a given temperature. (see Figure 11.4)
Figure 11.5: Distribution of kinetic energies of molecules in a liquid.
Figure 11.6: Rates of vaporization and condensation of a liquid over time.
Vapor Pressure • The vapor pressure of a liquid depends on its temperature. (see Figure 11.7) • As the temperature increases, the kinetic energy of the molecular motion becomes greater, and vapor pressure increases. • Liquids and solids with relatively high vapor pressures at normal temperatures are said to be volatile.
Boiling Point • The temperature at which the vapor pressure of a liquid equals the pressure exerted on the liquid is called the boiling point. • As the temperature of a liquid increases, the vapor pressure increases until it reaches atmospheric pressure. • At this point, stable bubbles of vapor form within the liquid. This is called boiling. • The normal boiling point is the boiling point at 1 atm.
Freezing Point • The temperature at which a pure liquid changes to a crystalline solid, or freezes, is called the freezing point. • The melting point is identical to the freezing point and is defined as the temperature at which a solid becomes a liquid. • Unlike boiling points, melting points are affected significantly by only large pressure changes.
For ice, the heat of fusion is 6.01 kJ/mol. Heat of Phase Transition • To melt a pure substance at its melting point requires an extra boost of energy to overcome lattice energies. • The heat needed to melt 1 mol of a pure substance is called the heat of fusion and denoted DHfus.
For ice, the heat of vaporization is 40.66 kJ/mol. Heat of Phase Transition • To boil a pure substance at its melting point requires an extra boost of energy to overcome intermolecular forces. • The heat needed to boil 1 mol of a pure substance is called the heat of vaporization and denoted DHvap. (see Figure 11.9)
A Problem to Consider • The heat of vaporization of ammonia is 23.4 kJ/mol. How much heat is required to vaporize 1.00 kg of ammonia? • First, we must determine the number of moles of ammonia in 1.00 kg (1000 g).
A Problem to Consider • The heat of vaporization of ammonia is 23.4 kJ/mol. How much heat is required to vaporize 1.00 kg of ammonia? • Then we can determine the heat required for vaporization.
Phase Diagrams • A phase diagram is a graphical way to summarize the conditions under which the different states of a substance are stable. • The diagram is divided into three areas representing each state of the substance. • The curves separating each area represent the boundaries of phase changes.
Phase Diagrams • Below is a typical phase diagram. It consists of three curves that divide the diagram into regions labeled “solid, liquid, and gas”. . B C solid liquid pressure . gas D A temperature
Phase Diagrams • Curve AB, dividing the solid region from the liquid region, represents the conditions under which the solid and liquid are in equilibrium. . B C solid liquid pressure . gas A D temperature
Phase Diagrams • Usually, the melting point is only slightly affected by pressure. For this reason, the melting point curve, AB, is nearly vertical. . B C solid liquid pressure . gas A D temperature
Phase Diagrams • Curve AC, which divides the liquid region from the gaseous region, represents the boiling points of the liquid for various pressures. . B C solid liquid pressure . gas A D temperature
Phase Diagrams • Curve AD, which divides the solid region from the gaseous region, represents the vapor pressures of the solid at various temperatures. . B C solid liquid pressure . gas A D temperature
Phase Diagrams • The curves intersect at A, the triple point, which is the temperature and pressure where three phases of a substance exist in equilibrium. . B C solid liquid pressure . gas A D temperature
Phase Diagrams • The temperature above which the liquid state of a substance no longer exists regardless of pressure is called the critical temperature. . B C solid liquid pressure . gas A D Tcrit temperature
Phase Diagrams • The vapor pressure at the critical temperature is called the critical pressure. Note that curve AC ends at the critical point, C. . B Pcrit C solid liquid (see Figure 11.13) pressure . gas A D Tcrit temperature
Figure 11.12: Phase diagrams for carbon dioxide and sulfur (not to scale).