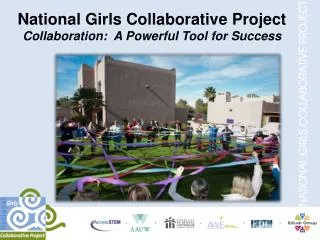
National Girls Collaborative Project
Advancing the Agenda in Gender Equity for Science, Technology, Engineering and Mathematics. National Girls Collaborative Project. Girls Girls and Science, Technology, Engineering, and Math (STEM): Where are We Today?. Where Are We Today?. Girls and Women in STEM. High School Performance


National Girls Collaborative Project
E N D
Presentation Transcript
Advancing the Agenda in Gender Equity for Science, Technology, Engineering and Mathematics National Girls Collaborative Project
Girls Girls and Science, Technology, Engineering, and Math (STEM): Where are We Today? Where Are We Today?
Girls and Women in STEM • High School Performance • Standardized Tests • College Degrees • The Workplace
National Assessment of Educational Progress (NAEP) • The Nation’s Report Card: national assessment of what American students know and can do in various subject areas • For students aged 9, 13, and 17 – girls slightly outperform boys on average in reading scores (1971 to 2004) • For students aged 9, 13, and 17 – boys slightly outperform girls on average in math scores (1973 to 2004) • Source: U.S. Department of Education, Institute of Education Sciences, National Center for Education Statistics, NAEP, selected years, 1971-2004 Long-Term Trend Reading Assessment and 1973-2004 Long-Term Trend Mathematics Assessments.
Mathematics and Science Combined High School GPA 1990-2005 SOURCE: U.S. Department of Education, Institute of Education Sciences, National Center for Education Statistics, High School Transcript Study.
High School Credits Earned in Math and Science 1990–2005 SOURCE: U.S. Department of Education, Institute of Education Sciences, National Center for Education Statistics, High School Transcript Study.
Who is Taking the SAT? • More girls than boys • 54% are girls (2007) • Girls more diverse group than boys • 58% of first-generation college students taking SAT are girls • Self-selected group SOURCE: College Board. 2007 College-bound Seniors: Total Group Profile Report
Proportion of Women in Selected College Majors 1999-2000 Bachelor’s Degree Recipients Education Psychology Health Social Sciences Humanities Other Biological Science Social Science Business/Management History Math/Physical Sciences Engineering NOTE: Excludes graduates older than 35 at completion of degree. SOURCE: U.S. Department of Education, National Center for Education Statistics, 2001 Baccalaureate and Beyond Longitudinal Study (B&B:01).
Degrees Awarded to Womenin Science and Engineering • In 2004, women in science and engineering* earned • 38% of bachelor’s degrees • 32% of master’s degrees • 31% of doctoral degrees *Biological, agricultural, earth, ocean, atmosphere and physical sciences, mathematics, computer science, and engineering. SOURCE: National Science Foundation NSF 07-307 Science and Engineering Degrees:1966-2004 January 2007
Women as a Proportion of Selected STEM Occupations, 2005 5.8% Mechanical Engineers 9.5% Engineering Managers 13.2% Civil Engineers Aerospace Engineers 13.3% Chemical Engineers 14.3% Industrial Engineers 14.9% 21.9% Computer Software Engineers 26.0% Computer Programmers 32.3% Database Administrators Chemists & Materials Scientists 35.3% Biological Scientists 48.7% Psychologists 67.3% 0% 10% 20% 30% 40% 50% 60% 70% 80% Source: CPST, Professional Women and Minorities . Data derived from U.S. Census Bureau, Current Population Survey
Average Weekly Earnings by Gender and Occupation (2003)full-time, employed, 1992-93 Bachelor's degree recipients NOTE: Excludes graduates older than 35 at completion of degree. SOURCE: Behind the Pay Gap: AAUW Educational Foundation, 2007. (U.S. Department of Education, National Center for Education Statistics, 2001 Baccalaureate and Beyond Longitudinal Study (B&B:01)).
Interest in STEM Fields is Low Among Girls • Survey of undergraduate women indicated that technical majors are not interesting.1 • High school girls who are good in math and science are less likely than less qualified boys to major in a STEM field in college. • Girls are more likely to pursue careers that are intrinsically rewarding • Boys pursue careers that provide extrinsic rewards like money and power2 • Not due to limitations in ability • 1Weinberger, C.J. (2004). IEEE Tech. Soc. Mag. 23(2), 28–35 • 2Schauman, K.A. (2005) Soc. Sci. Res.35, 577-619
Self-Assessment • Men make higher assessments of their own mathematical abilities than women.1 • The higher the self-assessment, the more likely a student is to enroll in and excel in a subject. 1Correll, S.J. (2004) Am. Socio. Rev., 69(1), 93–113
STEM Fields Are Stereotypically Male Are Stereotypically Male • Girls’ social roles conflict with science careers • Socialization for career choices is seen in children as young as six years old1 • Cultural models contrast femininity and STEM careers • Lack of female role models2 • Fewer women in STEM fields gives fewer opportunities for female role models • Difficult for many girls to be in the small minority in science & engineering classes 1Klein, S. S., ed. Handbook for Achieving Gender Equity Through Education, 2007. 2 Reskin, B. (1993). Ann. Rev. Sociology, 19, 241–70
“Leaky Pipeline” • Women more likely to leave STEM fields than men1,2 • 2 .5 times more likely to leave STEM fields • Half as likely to choose a STEM position • Half as likely to attend graduate school in STEM field 1 Joy, L. (2000) American Economic Review, 90(2), 471–5. 2 Joy, L. (2006) Economics of Education Review, 25(2), 221–31.
What Can Be Done to Increase Girls’ Participation in STEM? • Give girls specific information about STEM careers and provide hands-on experiences1 • Encourage girls to take math classes in high school2 • Challenge stereotypes • Show women in nontraditional roles 1 Klein, S. S., ed. Handbook for Achieving Gender Equity Through Education, 2007 2 Trusty, J. (2002) J. Counsel. Dev., 80, 464–74
National Institute for Women In Trades, Technology, and Science (www.iwitts.com) To order this poster click on WomenTech E-Store
National Institute for Women In Trades, Technology, and Science (www.iwitts.com) To order this poster click on WomenTech E-Store
The National Girls Collaborative Project in Advancing the Agenda
Project History • Northwest Girls Collaborative Project in Oregon and Washington (2002-2004) • Northwest model replicated in California, Wisconsin, Massachusetts (2004-2006) • Two additional regions independently funded: Midwest Rural Urban & South Central (2005-2007) • National Girls Collaborative Project Extension Services Grant w/AAUW and AWE (2006-2011)
Goals & Objectives WHAT • Maximize Access to Shared Resources • Strengthen Capacity of Existing Projects • Create the Tipping Point for Gender Equity in STEM HOW • Implementation of theCollaborative Model • Dissemination & Outreach • Collaboration Support • Research & Evaluation
Components of the Model • Program Directory • Mini-Grants • Dissemination of Promising Practices • In-Person Events & Webcasts • Regional Support (AAUW) • Leadership Teams & Champions Boards • www.ngcproject.org
Why Collaborate? • To coordinate services available to girls interested in STEM careers • To reduce competition for scarce resources • To strengthen relationships among organizations • To gather information in a centralized location accessible to general public • To share promising practices
Collaborative Implementation 2009Midwest Middle Atlantic Pennsylvania 2008 Connecticut Great Lakes Kentucky Maine TennesseeTexasNortheast 2007 California Florida North Carolina Northwest
AAUW Members Serving as NGCP Regional Liaisons • Connect • Support • Promote
AAUW Regional Liaisons • CaliforniaMarie Wolbach –mwolbach@jps.net • Connecticut & PennsylvaniaDot McLane –dotmclane@comcast.net • FloridaJennifer McDaniel – j2mcd@yahoo.com • Great Lakes (IN, MI, OH, WI, MN) & Midwest (IL, IA, MO) Geraldine Oberman – goberman@uchicago.edu • KentuckyEllen Nolan – EllenT.Nolan@ky.gov • MaineAnja Whittington – anja.whittington@umpi.edu
AAUW Regional Liaisons • Middle Atlantic (DC, MD, VA)Elizabeth Vandenburg – evandenburg@verizon.net • North CarolinaSusan Metz – spasmetz@hotmail.com • Northeast (MA, NH, RI, VT)Kimberly Edgar – kimberlyedgar@aol.com • TexasKristian Trampus – kristian.trampus@gmail.com • Diversity Outreach LiaisonLetha Granberry – lethagranberry@yahoo.com
How You Can Help the NGCP Grow the Program Directory at www.ngcproject.org • Register your girl-serving STEM program • Register your branch • Encourage other organizations to sign up Become involved with your regional collaborative • Attend Collaborative events • Apply for a mini-grant • Volunteer your time or expertise
Project Benefits to Participants • Networking with other professionals who share common goals • Professional development • Access to resources & partners • Project funding through mini-grants
Benefits to Replication Sites • Opportunity to take regional leadership in initiating and expanding STEM activities • Direct funding to support and motivate collaboration in your local area • Opportunities to network and strategize with regional collaborative teams throughout the U.S. • Electronic tools:Online Program Directory, Online Mini-Grant Award Application, Project Web Site, Regional Listserv and Newsletter Software, SharePoint
How Can You Benefit from NGCP? • Program Directory • Website Resources & Listserv • Webcasts • Mini-Grants • Collaborative Events What Can I Do Today? • Sign up in the program directory • Elect to receive the monthly newsletter • Contact your AAUW Regional Liaison
Useful Websites Project Homepagewww.ngcproject.org AAUW NGCPwww.aauw.org/education/ngcp
AAUW Reports on Girls in STEM Reports available at www.aauw.org under Research
Girls and Women Have Made Great Progress in STEM Fields • Policy changes work! • Still work to be done –Potential of girls notyet fully realized
References • Correll, Shelley J. (2004, February). Constraints into preferences: Gender, status, and emerging career aspirations. American Sociological Review69(1), 93–113 • Joy, Lois. (2000, May). Do colleges shortchange women? Gender differences in the transition from college to work. Papers and proceedings of the 112th annual meeting of the American Economic Association. American Economic Review90(2), 471–5 • Joy, Lois. (2006). Occupational differences between recent male and female college graduates. Economics of Education Review25(2), 221–31. • Klein, Susan S., ed. Handbook for Achieving Gender Equity through Education Lawrence Erlbaum Associates, Inc.: Mahwah, NJ, 2007. • Reskin, Barbara. (1993). Sex segregation in the workplace. Annual Review of Sociology, 19, 241–70 • Shauman, K.A. (2005) Occupational Sex Segregation and the Earnings of Occupations: What causes the link among college-educated workers? Social Science Research35, 577-619 • Trusty, Jerry. (2002, September). Effects of high school course-taking and other variables on choice of science and mathematics college majors. Journal of Counseling and Development, 80, 464–74 • Weinberger, Catherine J. (2005). Is the Science and Engineering Workforce Drawn from the Far Upper Tail of the Math Ability Distribution? Working Paper. Institute for Social, Behavioral, and Economic Research and Department of Economics, University of California at Santa Barbara. • Weinberger, Catherine J. (2004, Summer). Just ask! Why surveyed women did not pursue IT courses or careers. IEEE Technology and Society Magazine, 23(2), 28–35