Download
1 / 23
230 likes | 387 Vues
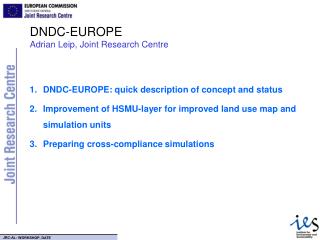
Integrating an economic model for European agriculture with a mechanistic model to estimate nitrogen and carbon losses from arable soils in Europe – net climate impact of rapeseed cultivation for biofuels. Adrian Leip. European Commission – Joint Research Centre

E N D
Integrating an economic model for European agriculture with a mechanistic model to estimate nitrogen and carbon losses from arable soils in Europe – net climate impact of rapeseed cultivation for biofuels Adrian Leip European Commission – Joint Research Centre Institute for Environment and Sustainability Climate Change Unit TFIAM/COST729/NinE Workshop on integrated modelling of nitrogen 28-30 November, 2007 – Laxenburg, Austria
CAPRI • Co-authors • Changsheng Li, University of New Hampshire • Giulio Marchi, Joint Research Centre • Lorenzo Orlandini, Joint Research Centre • Markus Kempen, Universität Bonn • Renate Köble, Joint Research Centre (now IER Stuttgart) • Wolfgang Britz, Universität Bonn (now Joint Research Centre)
Relative warming derived from N2O production Crutzen et al. 2007, Atmos. Chem. Phys. Discuss.
Application of CAPRI/DNDC-EUROPE on rapeseed cultivation in Europe • Policy framework • CAPRI / DNDC-EUROPE • Set-up of bio-crop simulations • Does N2O negate CO2 savings?
Renewable energy directive • Biofuel directive 2003 • Target for min. proportion for biofuels: 5.75% (energy content) of all petrol and diesel for transport purposes by dec. 2010 • Commission Communication: Limiting Global Climate Change to 2ºC (2007) and EU Spring Summit 2007 • Binding targets for the overall share of renewable energy (20%) and for the share of biofuels in petrol and diesel (10%) in 2020 • Directive on renewable energy (DG TREN finalized by end 2007) • Targets confirmed • Sustainability criteria • Achieving a minimum level of GHG savings • Avoiding major reduction in carbon stocks through land use change • Avoiding major biodiversity loss from land use change
Fuel quality directive • DG-ENV is proposing to amend the fuel quality directive to include GHG efficiency of the EU road-fuel mix • decrease of 10% in the average GHG-intensity of road fuel • most of it must come from the use of bio-fuels • stronger target than renewable energy directive requires comprehensive and careful lifecycle analysis including N2O emissions!
CAPRI-MODEL • A “multi-purpose” modeling system for EU’s agriculture, allows to analyze • Market policies (administrative prices/tariffs/preferential agreements) • Premium systems/quotas/set-aside at regional level (CAP) • Environmental policies (standards/market solutions)
CAPRI - DNDC-EUROPE Socio-economic database GIS environmental database European national and international statistics Geographic data Climate data and N deposition CAPRI DNDC Policy framework National market/trade Definition of environmental scenario Soil information Global trade framework Farm Management Regional agricultural system + economic and environmental indicators Aggregation to modeling spatial units Regional statistics Agricultural land use map Production level and farm input estimation at spatial calculation units Simulation at modeling spatial unit • Environmental indicators • - N2O, N2 • NOx • CH4 • NH3 • Nitrate leaching • Carbon Stocks • Energy • … Developed in CAPRI-DynaSpat Leip et al, 2007, Biogeosciences Discussions
CAPRI-DynaSpat Agricultural Land Use Maps • For each Spatial Unit: • 29 crop maps (crop area) • Livestock density • Mineral fertilizer and manure application rate by crop and polygon • Yield
HSMU-layer Set-up of DNDC • Climate • MARS 50 km2, daily (1982-2006) • Deposition: EMEP • Soil: • ESB 1 km raster data (Hiederer & Jones: SOC, base saturation, clay content, packing density), 65 year spin-up run • Land Use: • CAPRI-DynaSpat Land Use Map • Farm Management • N application: EFMA/IFA/FAO + CAPRI • Yield: DNDC + CAPRI • Sowing dates: Bouraoui & Aloe. • Irrigation: FAO • Other farm data: Li et al. GIS Database DNDC- EUROPE* * modified DNDC V.89 to accommodate simulations of HSMU for in- and output handling
Generation of crop rotation • Linked to land uses within simulation unit • A priori assumption on possible rotations Rotations are generated consistent with national statistics, environmental conditions, and farm practice recommendations
CO2 savings vs. N2O emissions • Direct emissions: 5 kg N2O-N/ha • Indirect emissions (DNDC): • 25 kg N leaching (2.5% EF) • 50 kg N volatilised (1%EF) kg CO2-eq ha-1 Yield: 1300 kg C/ha (DNDC) Energy input fossil fuel: 0.16 MJ/MJ (JEC, 2007. Well-to-Wheel study)
On-farm energy input • Detailed assessment of energy requirements (CAPRI) • Direct energy input • Fuel for farm machinery • Lubricants • Electricity • Indirect energy input • Plant protections/Irrigation/Seeds • Depreciation/Repair of farm machinery and buildings • Drying of cereals Kraenzlein et al., 2007
GHG emissions from fertilizer manufacture • Main use of fertilizer • Emission factors EFMA, 1997 & Wood and Cowie, 2004
GHG balance of rapeseed cultivation (I) kg CO2-eq ha-1 Credits for the use of co-products (JEC, 2007. Well-to-Wheel study) Overall GHG balance:savings: -40% Comparison of CO2 savings vs. N2O emissions: savings: -8%
GHG balance of rapeseed cultivation (II) kg CO2-eq ha-1 Carbon-sink sensitivity to N deposition 25 g C / g N Contribution to carbon sequestration: 10% of volatilizes NH3+NOx+Nbiofuel
GHG balance of sugarbeet cultivation kg CO2-eq ha-1 GHG balance: savings: 57%
Conclusions • Regionalization of the assessment is a pre-requisite for policy advice • Matching of agricultural activities with soil and farm management can change the picture • The current simulation results suggest significant N2O emissions • For rapeseed similar magnitude then CO2 savings, for sugar beet less • Effect of carbon can be huge • Improvement of estimates urgent • The methodology allows a detailed analysis of N2O emissions from biofuel production • Scale-consistency “from plot to continent” • Consistency with cultivation pattern and farming practices • Comprehensive ex ante policy analysis possible (incl. structural changes) • Challenge to factor-out marginal emissions caused by bio-fuels • How would the land be used otherwise? • Where is the ‘former’ land use happening now?