Download
1 / 15
150 likes | 290 Vues
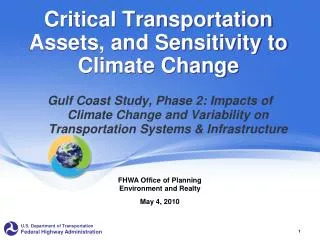
This presentation from the 2008 Midwest Transportation Planning Conference explores the intersection of transportation and climate change. It highlights key issues such as freight tonnage across nine states, ethanol production versus consumption, highway safety, and congestion costs totaling $78 billion annually. The discussion emphasizes multi-modal solutions to reduce vehicle miles traveled (VMT), improve transit ridership, and enhance freight capacity. Planners are encouraged to integrate these strategies into their long-range plans immediately, focusing on innovative funding options and local involvement for sustainable development.

E N D
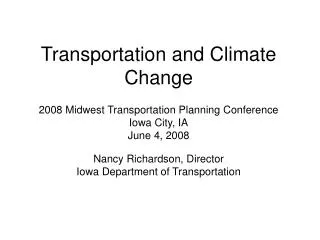
Transportation and Climate Change 2008 Midwest Transportation Planning Conference Iowa City, IA June 4, 2008 Nancy Richardson, Director Iowa Department of Transportation
9-State Freight Tonnage(Illinois, Indiana, Iowa, Kansas, Minnesota, Missouri, Nebraska, S Dakota, Wisconsin) Source: FHWA FAF
U.S. Ethanol Production Source: Renewable Fuels Association
Ethanol Production vs Consumption 9-States produce 88 % of the US total 2-States consume 33 % of US total Source: Renewable Fuels Association
Biofuels Impact on Transportation • Highway network—safety, condition and capacity • Rail line capacity, equipment and unloading facilities • Potential pipeline from Midwest to east coast • Transport of cellulosic materials
9-State VMT(Illinois, Indiana, Iowa, Kansas, Minnesota, Missouri, Nebraska, S Dakota, Wisconsin) Source: FHWA Highway Statistics
U.S. Travel Congestion Costs • $78 billion annual drain on the U.S. economy (delay and fuel cost) • 4.2 billion lost hours • 105 million weeks of vacation • 2.9 billion gallons of fuel wasted • 58 fully loaded supertankers Source: Texas Transportation Institute, 2007 Urban Mobility Report
Comparison of Metro Area Congestion Costs All 437 Urban Areas = 38 Source: Texas Transportation Institute, 2007 Urban Mobility Report
Greenhouse Gas Reduction Efforts • AASHTO Goals • Reduce oil consumption by 20 percent in 10 years • Double fuel efficiency of new passenger cars and light trucks by 2020 and entire fleet by 2030 • Double transit ridership by 2030 and significantly expand market share of passengers and freight on rail • Reduce projected growth in VMT by 50 percent • Reduce percentage of commuters who drive alone to 1980 levels and increase percentage of those that ride transit, car pool, walk, bike or work at home • Likely emphasis in next authorization bill • State initiatives
Multimodal Solutions to Reduce VMT Growth • Reduce SOV travel • Improve trucking efficiency • Increase public transit ridership • Increase rail passenger service/ridership • Increase rail freight capacity • Increase bicycling and walking • Support water transportation
Multi-modal Benefits • To handle increasing freight/passenger demands • To alleviate congestion/bottlenecks • To keep the Midwest competitive in the world market • To provide shipper/traveler choices • To achieve the most efficient movement of goods and people • To address environmental issues
Mission of Planners • Implementation of these solutions starts with planners • Integrate into planning process, long-range plans • Need to do it now, can’t wait for federal requirement • Get involved in activities at the state/local level • Multi-modal funding