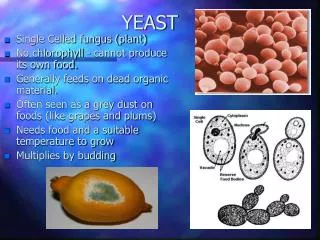
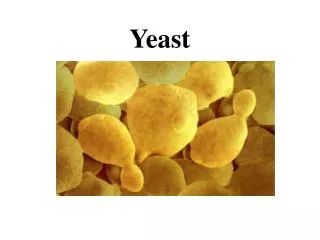
Yeast Cultivation
Yeast Cultivation. Course 27033 BioCentrum-DTU Technical University of Denmark January 2006 By, Marta Karolina Mustafa Shanshan Vijaya Krishna. Introduction. Types of cultivation - Batch - Chemostat – Pulse input Glucose repression Crabtree effect . Batch Cultivation.

Yeast Cultivation
E N D
Presentation Transcript
Yeast Cultivation Course 27033BioCentrum-DTUTechnical University of DenmarkJanuary 2006By,Marta KarolinaMustafaShanshanVijaya Krishna
Introduction • Types of cultivation - Batch - Chemostat – Pulse input • Glucose repression • Crabtree effect
Batch Cultivation • Cultivation conditions - 4L working volume; pH around 5; 10g/L initial glucose conc.; 10g/L initial galactose conc.; 600rpm; air flow 1 v/v/min; temperature 30˚C - Standard CBS Medium
Yeast Strains • CEN.PK-113-7D (haploid lab strain) as wild type organism - OD600 of shake flask was 2,835 - Inoculum volume was 175 ml • ∆snf1 (CEN.PK-506-1C) as mutant organism - OD600 of shake flask was 2,915 - Inoculum volume was 175 ml
Measurements • Cultivation time was 24h • Samples were taken every hour between t= 0-10 and after 24h • Samples at t= 1-10 and 24 data were taken for OD, pH, CO2, O2, and at t= 4-10 and 24 data were taken for DW • Samples at t= 0-10 and 24 were analyzed by HPLC
Crabtree Effect C6H12O6 + O2→ Cells + CO2 (Respiration) C6H12O6→ Cells + CO2 + C2H6O (Fermentation)
Method • Two strains one wild-type and one of the glucose repression mutant • Batch cultivation performed in a 5L reactor
Specific growth rate method m CO2 0.427 DW 0.375 OD 0.217
Specific growth rate method m CO2 0.0063 DW 0.461 OD 0.342
Chemostat – Pulse input • Strain used - Wildtype DGI 342 • Pulse of glucose given to a chemostat running at steady state • Conentration of pulse – (2.5g/l glucose and 2.5 g/l galactose) • Samples taken in defined time intervals for 180 minutes for analysis
The filter has a holding volume. • Glucose hydrolysed molecule (C6H12O6.H2O) • Biomass yeild on ethanol - increase in biomass from 150 to 180 min to the decrease in ethanol in the same time interval
Previous Experimental Data D=0.342
So, from the curve fitting, ms = 0.0164; Y_xs_true = 1.83263; So, Y_sx_true = 1/ Y_xs_true = 0.547555 D=0.342
Conclusions • No growth was seen on galactose for the mutant strain (∆snf1) – clear sign of the strain unable to use other carbon sources and glucose repression • Glucose repression was obeserved for the wild type as the galactose was utilized only at low concentrations of glucose • The yeild of biomass on glucose is observed to be less for the mutant strain • From the chemostat, for the strain DGI 342(WT), more ethanol is produced because of the crabtree effect because of high dilution rate