Download

1 / 44
440 likes | 766 Vues
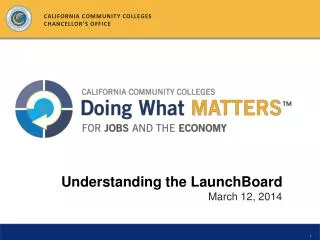
LaunchBoard Demo. The LaunchBoard offers a suite of dashboards that helps community colleges track progress toward economic mobility. Community College Pipeline : program review Guided Pathways tab : first year progress indicators SWP tab : end-of-college indicators

E N D
The LaunchBoard offers a suite of dashboards that helps community colleges track progress toward economic mobility • Community College Pipeline: program review • Guided Pathways tab: first year progress indicators • SWP tab: end-of-college indicators • K14 CTE Pathway tab: transition from K-12 into college • Adult Ed Pipeline: transition from adult ed into college (summer 2018)
Brings together many different data sources • Student and program data, including characteristics, progress, and completion from the CCCCO MIS database (populated by colleges) • Employment and earnings data from Employment Development Department • Employment outcomes from the CTE Outcomes Survey • Labor market information from EMSI • K12 information from CALPADS (uploaded by K12 Cal-PASS Plus members) • K12 adult educationinformation from CASAS
Resources Access a searchable database of resources, or find related resources embedded in the Community College Pipeline
Community College Pipeline Community college offerings, student characteristics, milestones, completion, and employment outcomes to support program review and planning
View information at three levels of specificity • Six high-level metrics on key points in students’ journeys • Six infographics designed to support data-informed conversations about student progress, including equity gap analyses • Detailed data charts and tables with: • The ability to view disaggregated results • Options to compare results to any other institution or program • Time trends • Information on the top programs in the state
Information can be viewed at various program levels • All programs • All CTE programs • All non-CTE programs • Sector (e.g., Health) • Sub-Discipline (e.g., Nursing) • Field (e.g., Licensed Vocational Nurse) • Credit, noncredit, or both credit and noncredit • Information can be viewed at various institutional levels • Statewide • Macroregion • Microregion • College
Type your selection criteria to see related options or scroll
Overview Showcases results on six metrics that highlight critical points in student journeys
Summary: Offerings Learn how many students are enrolled in the program, and at which institutions, in Doing What Matters macroregions
Summary: Students See demographic breakdowns as well as contextual information on skills-builders, stackable credentials, and part-time status
Summary: Students View an equity gap analysis for age group, gender, or race/ethnicity that compares program-level enrollments to overall college enrollments
Mouse over groups with gaps to understand the number of students needed to close the gap
Summary: Milestones Examine whether students in the program return from fall to spring, or over three terms, both at the college and in the region
Summary: Employment See what percentage of students got a job and whether the job was related to their field of study
Summary: Employment Examine how completion status affects employment rates and learn about the types of related jobs in the region, both after community college or once having earned a bachelor’s degree
Summary: Earnings See the proportion of students who attained the living wage and how much students earned by completion status
Summary: Earnings This tab also shows how student earnings compare to wages for related jobs in the region and relative earnings for various demographic groups.
Detailed Data Select any other type of college, region, or program to see comparison data
Detailed Data When a region is selected, view information for each college in the region
Detailed Data View dozens of additional metrics to better understand each phase in the student journey
Detailed Data See disaggregated data including age groups, gender, race/ethnicity, and completion status
Detailed Data Export results to support local and regional data use
Guided Pathways Tab First-year momentum points for evaluating college redesign efforts
View two possible cohorts • first-time ever in college • first-time students who had taken either summer or early college credits, at either the college or statewide level
See disaggregated and comparison data • race/ ethnicity • gender • age • type of prior enrollment • regional medians • statewide medians • the top program in the state • time trends
See disaggregated and comparison data • race/ ethnicity • gender • age • type of prior enrollment • regional medians • statewide medians • the top program in the state • time trends
See disaggregated and comparison data • race/ ethnicity • gender • age • type of prior enrollment • regional medians • statewide medians • the top program in the state • time trends
Strong Workforce Program Tab Completion and employment data for examining long-term outcomes
Access results for metrics associated with the Strong Workforce Program at the college, regional, and statewide level
Regional and statewide data is available on a public-facing site, which can be accessed from the Doing What Matters site or directly at: www.calpassplus.org/public/launchboard/swp.aspx
See disaggregated and comparison data • time trends • age group • economically disadvantaged • gender race/ethnicity • regional medians • statewide medians • top program in the state
See disaggregated and comparison data • time trends • age group • economically disadvantaged • gender race/ethnicity • regional medians • statewide medians • top program in the state
See disaggregated and comparison data • time trends • age group • economically disadvantaged • gender race/ethnicity • regional medians • statewide medians • top program in the state
K-14 CTE Transition Tab Outcomes for high school CTE students after they enroll in community college
See information as both a chart or a graph, comparing CTE and non-CTE students
See CTE students’ college readiness using the Multiple Measures algorithm, compared to the math and English courses they took
Learn whether CTE students continued to take related courses once in college, as well as comparing their 30 unit completion rates to non-CTE students
See whether CTE students earned a certificate, degree, or transferred
Export information to facilitate addition presentations of the data for local and regional planning