2001_FED_PC_PFC_Th_hyd
TBM Thermal Hydraulics


2001_FED_PC_PFC_Th_hyd
E N D
Presentation Transcript
Fusion Engineering and Design 55 (2001) 521–534 www.elsevier.com/locate/fusengdes Technical note Design and thermal-hydraulic analysis of PFC baking for SST-1 Tokamak Paritosh Chaudhuri *, D. Chenna Reddy, S. Khirwadkar, N. Ravi Prakash, P. Santra, Y.C. Saxena Institute for Plasma Research Bhat, Gandhinagar 382 008, India Received 24 February 2001; accepted 27 March 2001 Abstract The Steady-State Superconducting Tokamak (SST-1) is a medium-size tokamak with super-conducting magnetic field coils. Plasma facing components (PFC) of the SST-1, consisting of divertors, passive stabilisers, baffles, and poloidal limiters, are designed to be compatible for steady-state operation. Except for the poloidal limiters, all other PFC are structurally continuous in the toroidal direction. As SST-1 is designed to run double-null divertor plasmas, these components also have up–down symmetry. A closed divertor configuration is chosen to produce high recycling and high pumping speed in the divertor region. The passive stabilisers are located close to the plasma to provide stability against the vertical instability of the elongated plasma. The main consideration in the design of the PFC is the steady-state heat removal of up to 1 MW/m2. In addition to removing high heat fluxes, the PFC are also designed to be compatible for baking at 350°C. Different flow parameters and various tube layouts have been examined to select the optimum thermal-hydraulic parameters and tube layout for different PFC of SST-1. Thermal response of the PFC during baking has been performed analytically (using a Fortran code) and two-dimensional finite element analysis using ANSYS. The detailed thermal hydraulics and thermal responses of PFC baking is presented in this paper. © 2001 Elsevier Science B.V. All rights reserved. Keywords: Baking; Thermal-hydraulic; PFC; Steady-State Superconducting Tokamak mak with a major radius of 1.1 m and a minor radius of 0.20 m. It is designed for plasma dis- charge duration of ?1000 s to obtain fully steady-state plasma [1,2]. Plasma facing compo- nents (PFC) of SST-1 consist of two numbers of (top and bottom) inner divertor plates (IDP), outer divertor plates (ODP), inner passive stabilis- ers (IPS), outer passive stabilisers (OPS), and 1. Introduction The Steady-State Superconducting Tokamak (SST-1) is a super-conducting steady-state toka- * Corresponding author. Tel.: +91-2712-69031, ext. 318; Fax: +91-2712-69017. E-mail address: paritosh@ipr.res.in (P. Chaudhuri). 0920-3796/01/$ - see front matter © 2001 Elsevier Science B.V. All rights reserved. PII: S0920-3796(01)00184-3
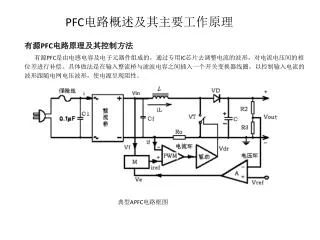
P. Chaudhuri et al. / Fusion Engineering and Design 55 (2001) 521–534 522 Fig. 1. Elevation view of plasma facing components inside the vacuum vessel of SST-1. welded on its inner wall, and all PFC will be baked by radiation from the heated VV wall. The thermal response of PFC during VV baking is shown in Fig. 3. The details of the radiation losses from VV to PFC during baking are re- ported in Ref. [5]. baffles, and one number of inner and outer poloidal limiters [3]. An elevation view of SST- 1, indicating all PFC, is shown in Fig. 1. All the PFC have the same basic configuration: graphite tiles are mechanically attached to high-strength copper alloys (CuCrZr or CuZr), and SS tubes are brazed in the grooves on the copper back plates as shown in Fig. 2. These tubes are used for both baking during wall conditioning and cooling during plasma operation. For ease of assembly inside the vacuum vessel, the PFC are designed to be modular [4]. The purpose of high-temperature bakeout is to clean the PFC and vacuum vessel (VV) to limit the outgassing during plasma operation. During the initial phase of operation of SST-1, it is planned to bake the VV at 250°C by flow- ing hot nitrogen gas Fig. 2. The schematic of the cross-sectional view of the PFC module. through the channels
P. Chaudhuri et al. / Fusion Engineering and Design 55 (2001) 521–534 523 Fig. 3. Temperature rise of FW components for a VV heating rate of 20°C/h. In later phases of operation of SST-1, if re- quired, the PFC will be baked independently at 350°C by flowing hot nitrogen gas while main- taining the VV at 150 or 200°C. If the power radiated by the PFC is more than the power needed to maintain the VV, then the VV needs to be cooled. If the power is less, then addi- tional power needs to be supplied to the VV to maintain that temperature. Thermal-hydraulics for independent baking of PFC is presented in this paper. Since there are many variables (flow rate, veloc- ity, pitch, tube length, diameter, etc.) that deter- mine the surface temperature of PFC, the effect of each variable was examined. An optimisation study was performed to find the best possible layout for PFC. The details of the optimisation study for all PFC are reported in Ref. [5]. In the steady state, the required baking power consists of the radiation and conduction power losses. The conduction losses arise due to the supports between the PFC and VV wall. The total conduction losses from PFC to the VV through these supports are neglected as it is found they are less compared with the radiation. The amount of radiated power loss from PFC to the VV surface depends on their temperature and their mutual exposed area. Surface radiative properties play an important role in thermal analysis of enclosures with radiatively interacting surfaces [7]. In such an analysis, the view factor plays a key role, which indicates the proportion of radiation leaving a surface and reaching some other specified surface by direct radiation trans- 2. Estimation of baking power requirement As the geometry of the PFC along with the VV is complicated, it is difficult to calculate the power radiated from each of the PFC to the VV analytically. The radiated power has been calcu- lated by two-dimensional (2D) finite element analysis using ANSYS [6]. Using these power requirements, all the thermal-hydraulic parame- ters for baking the PFC have been determined.
P. Chaudhuri et al. / Fusion Engineering and Design 55 (2001) 521–534 524 correctly estimate a good value for emissivity, since it greatly depends on the surface polishing and treatment. For the calculations presented in the present paper, the graphite, copper, and stainless steel (for the VV wall) emissivities were assumed to be 0.9, 0.3, and 0.2, respectively [10]. port. Often, the major difficulties in calculating the radiation exchange rest with the accurate de- termination of the view factors [8]. Particularly in the toroidal geometry, the calculation of view factors of a particular PFC to the VV (accord- ing to their respective lines of sight) is difficult as their views are obstructed either by other sur- faces in the enclosure or by themselves. Use of an inaccurate view factor may give a very high requirement of radiated power, which will lead to high requirements of velocity and hence high mass flow of gas. It is important to point out that surface emissivity also plays a critical role in this kind (radiative heat transfer) of calcula- tion, the results being quite sensitive to this parameter [9]. Nonetheless, it is very difficult to 2.1. Finite element model A fully fledged three dimensional analysis for the estimation of baking power requirement will need very high computer memory. A 2D repre- sentation of the full model has been considered with the equivalent surface areas where VV is assumed to have no ports and is surrounded by a liquid nitrogen (LN2) shield (at 80 K). The model is discretised with 877 (PLANESS) 2D elements, 422 LINK32 elements and 1139 nodes. LINK32 element is used for the radiation heat transfer. The ANSYS radiation LINK is uniax- ial element that defines the radiation heat flow rate between PFC and VV, as shown in Fig. 4. It calculates the view factors from each element of the PFC to all other elements (which have a direct line of sight) and hence determines the radiated power loss from all PFC to the VV, which are kept at 350 and 150°C, respectively. The contribution of power loss from each PFC (like IDP, ODP, IPS, OPS and baffle) has also been calculated. The results of the power re- quirement for all PFC are presented in Table 1. This table also presents the total and individual power requirements for PFC when VV is kept at 200°C. 3. Thermal hydraulic analysis The flow parameters for different PFC will be different as their power requirements are differ- ent (from Table 1). In steady-state bakeout (at 350°C), energy input to the PFC will be equal to the radiation and conduction heat losses from PFC to the VV. A Fortran code has been devel- oped to calculate the flow parameters like mass flow rate, velocity, heat transfer coefficient and Fig. 4. The 2D finite element model for radiation exchange between FW and VV.
P. Chaudhuri et al. / Fusion Engineering and Design 55 (2001) 521–534 525 Table 1 Radiated power for different PFC PFC VV at 150°C VV at 200°C Totala(kW) Moduleb(W) Total (kW) Module (W) IDP ODP IPS PS BF IL OL Total 3.51 10.11 2.48 9.12 4.92 0.34 0.60 31 kW 219.61 315.84 155.05 285.13 153.83 170.00 300.00 3.16 8.76 2.13 7.87 4.26 0.30 0.53 27 kW 197.49 273.71 133.13 245.87 133.05 150.00 265.00 aTotal power requirement for one particular PFC (for its all top and bottom modules). bPower requirement for one module of that particular PFC. pressure drop along the tube length for different PFC. The code calculates the conduction losses between the tube and the graphite surface, which includes the convective heat transfer from hot gas to the tube, the conduction heat transfer from the tube to the copper plate and, finally, from copper to graphite tiles through the thin flexible graphite layer. Thermal conductivities of all materials except graphite are assumed to be independent of temperature. The thermal con- ductivity of flexible graphite (grafoil) is consid- ered orthotropic [11]. thermal conductivity of graphite used in this cal- culation is expressed in the following empirical relation [12]. [13,14] were used for the thermal-hydraulic anal- ysis. Properties of nitrogen gas were used based on Ref. [15]. From the energy balance equation in steady state, Qrad=m ? Cp?T=(?VA)Cp?T (1) the convective heat transfer equation is ex- pressed as [13]: Qconv=hAtube?Tf where ?T=Tin−Toutand ?Tf=Twall−Tout. All symbols are described in Appendix A. The temperature in the PFC during baking depends on how efficiently the power (Qconv) is transferred by the fluid through the tube. The important parameters for the independent bak- ing of PFC are the heat transfer coefficient, pressure drop, and the pumping power. The ob- jective of the design is to maximise the heat transfer and to minimise the pumping power, and to ensure the desirable baking temperature in PFC. These parameters depend on the mass flow rate, tube geometry, type of fluid used and the fluid properties. In every module of the PFC, the gas enters the tube at the inlet temper- ature of Tin and leaves at the corresponding outlet temperature Tout. Since the temperature of the gas decreases with the length of the tube, the analysis has been performed at the end of the tube to account for the effect of the lowest temperature on the tile temperature distribution. (2) Temperature-dependent kGr(T)=k0×10C1T where k0is the thermal conductivity of graphite at room temperature (?100 W/m K), kGr(T) is the thermal conductivity of graphite at tempera- ture T, and C1= −1.74×e−4×k0 Nitrogen gas at 5 bar pressure has been cho- sen to bake the PFC at 350°C. High pressure or high fluid density improves the thermal capacity per unit volume and also helps to reduce the gas flux (mass flow rate), and hence the velocity, which is the main reason for choosing the pres- surised (5 bar) N2 gas as the heat transfer medium to bake the PFC of SST-1. Standard correlations for heat transfer coefficient (h), fric- tion factor ( f ), and pressure drops from Refs. −0.874.
P. Chaudhuri et al. / Fusion Engineering and Design 55 (2001) 521–534 526 The heat transfer coefficient, friction factor, and pressure drop are dependent on the mass flow rate, tube diameter, tube perimeter (contact length) and the prevailing flow conditions (lami- nar, turbulent flow). Dittus–Boeltus correlation (Eq. (3)) has been used for evaluating the heat transfer coefficient[13]. h=0.023Pr0.3Re0.8?k All thermal-hydraulic flow parameters are ob- tained by solving Eqs. (1) and (2). These equa- tions have four unknown parameters V, tinand tout, and twall. It is seen that the temperature drop due to conduction losses across the differ- ent layer is less than 2°C. The tube inner wall temperature is thus assumed in this calculation to be 352°C (which is 2°C more than the baking temperature). The calculation starts with the in- put of wall temperature, a specified velocity and tube diameter. The mass flow rate, Reynolds number, pressure drop, etc., are determined for that velocity and the Reynolds number gives the flow regime, which helps to select the appropriate correlation for the heat transfer coefficient. Here, each velocity gives one combination of inlet and outlet tem- perature. The suitable combination should have an inlet temperature of about 400°C, an outlet temperature greater than 350°C, and velocity of less than its limiting value. The limiting value of the gas velocity is restricted to 10% of its sonic velocity (50 m/s, for N2at 5 bar), which is gen- erally adopted as the design parameter. The cal- culation is repeated and examined for different layouts and, ultimately, one layout has been chosen for which the desired inlet, outlet tem- peratures and the velocity are obtained. The de- tails of the layout corresponding flow parameters of different PFC are given in the next section. selection and its d? 4. Scoping studies (3) Having selected three diameters (8, 10, and 12 mm), and different tube lengths, scoping studies have been performed on each to determine their optimum layout configuration and thermal-hy- draulic parameters. The results for one IDP (in- board Divertor Plate) module only are described in the present paper. The same procedure is fol- lowed for other PFC also. 4.1. Tube layout selection tube diameter. The The tube layout selection has been carried out for many possible layout combinations ranging from one pass to the maximum number of passes practically possible. Table 2 presents a few possible layouts and their corresponding thermal hydraulic parameters for the IDP mod- ule for three different tube diameters (8, 10 and 12 mm). Out of them, only one has been se- lected for which all the criteria (velocity, pitch, inlet, outlet temperature, etc.) for baking are sa- tisfied. The variation of inlet and outlet temper- ature against velocity are shown in Fig. 5. From Table 2, it can be inferred that the 8 mm tube Table 2 Selection of layout for IDP baking V (m/s) Ltube(m) Pitch (mm) Diameter (mm) Tout(°C) Remarks 1.93 1.93 1.93 2.58 2.58 2.58 3.22 3.22 3.22 63 63 63 50 50 50 38 38 38 8 50.4 34.8 25.8 45.6 31.0 22.8 42.8 28.8 21 369.0 371.4 373.3 366.0 368.0 369.7 363.8 365.6 367.1 High V OK OK High V OK OK High V OK OK 10 12 8 10 12 8 10 12
P. Chaudhuri et al. / Fusion Engineering and Design 55 (2001) 521–534 527 Fig. 5. Variation of inlet and outlet temperature with velocity (for IDP). diameter cannot be considered as it needs high velocity to keep the inlet temperatures around 400°C. Tube diameters of 10 and 12 mm can satisfy the velocity limit. The advantage of se- lecting a 10 mm diameter and a tube length of 2.58 m is to have a suitable pitch length of 50 mm, which will give more effective heating and cooling (during plasma operation) compared with a tube length of 1.93 m, which gives the pitch of 63 mm. A tube length of 3.22 m is not considered as it gives the small pitch, which may lead to the fabrication difficulties during bending of the tube. Thermal hydraulic parame- ters of the selected tube configurations for all PFC baking (at 350°C) when VV is kept at 150 and 200°C are presented in Tables 3 and 4. efficient pumping. Although the wall friction over the fluid path (L) dominates, we have cal- culated the total pressure drop, which is the sum of the pressure drops due to friction, bends and the exit/entry points [13]. The frictional pressure drop across the tube length L is given by: ?Pf=fG2L 2gc?d Friction factor f for Reynold’s number is given as follows: f=0.316Re−0.25 for Re?2×10⁴ f=0.184Re−0.20 for 2×10⁴?Re?3×10⁵ (4) different ranges of (5) (6) f=(1.85×log Re−1.64)−2 for Re?3×10⁵ (7) 4.2. Pressure drop The bend pressure drop is given by ?Pb=KbG2 2gc? The total pressure drop should be only a small fraction of the fluid pressure to ensure (8)
P. Chaudhuri et al. / Fusion Engineering and Design 55 (2001) 521–534 528 The exit/entry pressure drop of the channel is given by: where the bend coefficient Kb is a function of the ratio of tube inner diameter and the ra- dius of curvature of the bend. Interpolated val- ues of this coefficient are used in the calcu- lation. ?Pe=1.8G2 (9) 2gc? Table 3 Flow parameters and tube layout details for different PFC baking (when PFC is kept at 350°C and VV at 150°C IDP ODP IPS OPS BAFFLE I-LIM O-LIM Flow parameters Velocity (m/s) Mass flow (per module) Total (all modules)a(kg/s) HTC (W/m2K) Tin(°C) Tout(0C) Pressure drop (bar) Pumping Power (W) 31.0 0.0062 0.09 339.4 400.0 368.0 0.37 90.74 31.5 0.0063 0.201 343.8 400.0 354.8 0.34 77.10 23.8 0.0049 0.0784 247.7 400.0 370.5 0.19 34.96 24.8 0.0051 0.1632 283.9 400.0 352.2 0.28 54.70 24.0 0.0049 0.1568 276.5 400.0 370.1 0.18 34.31 29.2 0.0038 0.0076 338.3 400.0 359.0 0.28 40.11 29.5 0.0039 0.0156 341.1 400.0 364.3 0.23 34.33 Tube layout details Tube length (m) Pitch (m) Tube inner diameter (m) Number of bends (180°) 2.58 0.050 0.010 3 2.76 0.050 0.010 5 1.94 0.050 0.010 2 2.90 0.050 0.010 6 1.88 0.050 0.010 4 1.45 0.040 0.008 4 1.16 0.040 0.008 3 Module details Number of modules (top+bottom) Poloidal length of the module (mm) Toroidal length of the module (mm) Area of each module (m2) Area of all the modules (m2)b 16 32 16 32 32 2 2 187.5 644.0 0.121 1.94 267.5 460.0 0.123 3.94 117.5 648.0 0.076 1.22 330.0 415.0 0.137 4.38 264.0 375.0 0.10 3.2 290.0 180.0 0.052 0.10 290.0 310.0 0.090 0.18 Power required (Qrad) per module (W) 219.61 315.84 155.05 285.13 153.83 170.00 300.00 aTotal mass flow rate for all FW components (top+bottom), ?0.708 kg/s. bSurface area (facing to the plasma) of all FW components, ?15 m2. Table 4 Flow parameters for different PFC (when PFC is kept at 350°C and VV at 200°C) Flow Parameters IDP ODP IPS OPS Baffle I-LIM O-LIM Velocity (m/s) Mass flow (per module) Total (all modules)a(kg/s) HTC (W/m2K) Tin(°C) Tout(°C) Pressure drop (bar) Power required (Qrad) per module (W) 27.6 0.0055 0.0880 309.3 400.0 367.8 0.30 197.49 24.4 0.0056 0.1790 312.2 400.0 362.0 0.33 273.71 20.2 0.0041 0.0784 240.9 400.0 385.0 0.14 133.13 21.0 0.0043 0.1632 248.5 400.0 351.0 0.22 245.87 20.0 0.0041 0.1312 239.0 400.0 370.1 0.14 133.65 25.4 0.0033 0.0092 302.6 400.0 379.2 0.21 150.00 25.8 0.0034 0.0156 306.4 400.0 381.8 0.18 265.00 aTotal mass flow rate for all FW components (top+bottom), ?0.647 kg/s.
P. Chaudhuri et al. / Fusion Engineering and Design 55 (2001) 521–534 529 Fig. 6. Variation of mass flow rate and pumping power for different tube diameter. 5. Results and discussions Total pressure drop is ?Ptotal=?Pf+n?Pb+2?Pe (10) PFC baking has been designed following an exercise involving examination of gas velocity (to limit its maximum allowable value), maximum heat transfer capability, tube length, diameter, etc. For different PFC considered, scoping studies give optimum thermal-hydraulic parameters for each characterised by the requirement of radiated power and an optimum tube layout. The velocity of the gas is limited to prevent the noise and vibration, and to be significantly subsonic. Fig. 7 shows the variation of the heat transfer coefficient with mass flow rate for three different tube diame- ters. This shows that, to achieve maximum heat transfer values, it is more efficient to decrease the dimension of the tube rather than increase the mass flow rate (or velocity). The increase in heat transfer coefficient values either by smaller tube diameter or larger mass flow leads to an increase in pumping power (Fig. 6). This figure also shows a small kink at mass flow rate of 0.0039, 0.0049 where n is the number of bends in the circuit. 4.3. Pumping power The pumping power is given by [14]: P=m ? ?P ? (11) The pressure and density do not directly affect the heat transfer capacity of the fluid, but do affect the pumping power. A high fluid density or pressure is important if the pumping power is to be kept low. In principle, a similar effect can be achieved by employing larger tube diameter (Fig. 6). However, this is at the expense of heat transfer capability, since the heat transfer rate decreases with the increasing tube diameter (Fig. 7). So, minimisation of the pumping power should be weighted against lower heat transfer coefficient and lower temperature in the PFC [16].
P. Chaudhuri et al. / Fusion Engineering and Design 55 (2001) 521–534 530 and 0.0059 kg/s for tube diameters of 8, 10 and 12 mm, respectively. This is because of the change of friction factor value due to the transition of the Reynold’s number range as specified according to the flow regime (Eqs. (5)–(7)). Increasing ?T from 25 to 50°C results in a decrease in mass flow rate by a factor of 2 (Fig. 8a); heat transfer coefficient decreases by a factor of 1.7 (Fig. 8b), and the pumping power by a factor of 6.8 (Fig. 8c). This indicates that the effect of decreasing mass flow rate and heat transfer coefficient values on the PFC baking temperature is minimal (Fig. 8d). this model. The temperature at different loca- tions in a PFC module has been determined by ANSYS as well as by the code where the one- dimensional conduction equation has been used. The temperature of graphite, graphite–grafoil junction, copper–grafoil junction, and copper have been determined at different locations (A, B, C, D, E, F, and G) of the model as shown in Fig. 9. The finite element discretisation has been carried out on this model by 2D PLANE 55 elements with four nodes. This requires the heat transfer coefficient and fluid temperature as the input parameter. For this calculation, the surface AB (graphite plasma) in Fig. 9 is considered as the radiating surface, and the adiabatic boundary condition is applied to other surfaces, e.g. AG, GH, and IB surfaces. Four materials are present within the model: graphite at the upper zone, copper in the lower zone, a flexible graphite that connects copper and graphite, and a SS as the tube at right bottom corner of the model considered (Fig. 9). Table 5 shows the temperature at the surface facing to the 5.1. Temperature response in PFC The study of the thermal responses of PFC during the bakeout has been performed by AN- SYS on a single tile model as shown in Fig. 9. Orthotropic thermal properties of grafoil and isotropic temperature-dependent thermal proper- ties of graphite and the required radiated power (from Table 1) have been given as the input in Fig. 7. Variation of mass flow rate and heat transfer coefficient for different tube diameter.
P. Chaudhuri et al. / Fusion Engineering and Design 55 (2001) 521–534 531 Fig. 8. Variation of different hydraulic parameters with ?T. 6. Conclusions locations A, C, E, and G in Fig. 9 corresponds to graphite, graphite–grafoil junction, grafoil– copper junction and copper, respectively, at the maximum distances from the tube centre. The results obtained from the Fortran code are found to be in very good agreement with those obtained from ANSYS (Table 5). Maxi- mum difference in temperature between ANSYS and code is found to be 1.92°C, which means the temperature distribution is within 1% of de- viation between the code and ANSYS results. The temperature profile of ANSYS results of one such PFC (for IDP) is shown in Fig. 10. The maximum and minimum temperature at the tube and graphite surface (for IDP) are 350.98 and 349.81°C, respectively, which ensures the desired baking temperature PFC materials. The details of the temperature responses of other PFC Ref. [5]. The PFC baking design and its thermal-hy- draulic analysis have been examined. It gives reasonable thermal hydraulic parameters ensur- ing the design requirements on the surface tem- perature of all PFC at 350°C during baking. Thermal analysis requires consistent data for the layout geometry, radiated power loss during baking, and fluid conditions. These data allow calculation of the temperature distribution in the module with the aid of a finite element analysis code. The results show that the design for PFC achieves the desired baking temperature with small temperature gradients across the material to avoid the excessive cyclic stresses. Various parameters for thermal performance have been weighed against each other, and optimisation of the tube layouts and thermal-hydraulic parame- ters have been performed. of 350°C in are reported in
P. Chaudhuri et al. / Fusion Engineering and Design 55 (2001) 521–534 532 The choice of tube layouts for different PFC have been systematically compatibility of baking and cooling. Alternative layouts have, however, been identified (in case the tile design does not permit a particular layout), which also satisfy all demands for both baking and cooling, and an adequate margin for velocity and surface temperature. The comparison of the ANSYS and the analytical results have been carried out and revealed a very good agreement within a 1% deviation. examined for Acknowledgements The authors wish to thank Prof. P.K. Kaw and all colleagues of SST-1 team members for their keen interest in this work. Appendix A. Nomenclature cross-sectional area of the tube (m2) specific heat at constant pres- sure (J/kg K) diameter of the tube (m) friction factor =?×V; the mass velocity (kg/m2s) 1, for pressure in N/m2, and 9.8 m/s2for pressure in kg/m2 heat transfer coefficient (W/ m2K) thermal conductivity of gas (W/m K) tube length (m) mass flow rate (kg/s) nustle number (–) total pressure drop (bar) pressure drop due to friction (bar) pressure drop due to bends (bar) pressure drop due to entry and exit (bar) A Fig. 9. Different location of temperature measurements in the single tile model. Cp d f G Table 5 Temperature response at different locations of all PFC PFC At A (°C) At C (°C) At E (°C) At G (°C) gc IDP Code ANSYS h 350.83 349.81 350.88 350.44 351.97 350.57 351.98 350.64 k ODP Code ANSYS 350.31 349.38 350.39 350.211 351.96 350.46 351.97 350.56 L m Nu ?P ?Pf IPS Code ANSYS 351.17 350.51 351.211 351.17 351.98 351.37 351.98 351.45 OPS Code ANSYS 350.47 349.79 350.55 350.454 351.96 350.66 351.97 350.74 ?Pb Baffle Code ANSYS 350.35 349.39 350.43 349.88 351.96 350.04 351.97 350.09 ?Pe
P. Chaudhuri et al. / Fusion Engineering and Design 55 (2001) 521–534 533 Fig. 10. Temperature profile on the single tile model of IDP (result obtained from ANSYS). pumping power (W) Prandtl Number (=(?Cp/K) power required for baking (W) Reynolds number (=(?Vd)/ ?) temperature difference be- tween inlet and outlet (Tin−Tout) temperature difference be- tween wall temperature and fluid temperature at the outlet point (Twall−Tout) temperature of gas (°C) velocity of gas (m/s) inner divertor plate outer divertor plate inner passive stabiliser outer passive stabiliser inner limiter outer limiter P Pr Q Greek letters ? dynamic viscosity of gas (Pa/ s) density of the gas ? Re Subscripts wall f in out rad conv pertains to the wall film temperature inlet temperature outlet temperature radiation convection ?T ?Tf T V IDP ODP IPS OPS I-LIM O-LIM References [1] Y.C. Saxena, SST-1 Team, Present status of the SST-1 project, Nuclear Fusion 40 (6) (2000) 1069. [2] S.P. Despande, SST-1 Team, Proceedings of the 17th IEEE/NPSS Symposium on Fusion Engineering, San Diego, CA, Vol. 1, 1997, p. 227.
P. Chaudhuri et al. / Fusion Engineering and Design 55 (2001) 521–534 534 [3] S. Jacob, P. Chaudhuri, et al., Proceedings of the 1st IAEA Technical Committee Meeting on Steady State Operation of Tokamaks, Hefei, China, 13–15 October 1998. [4] Y.C. Saxena, Proceedings of the 2nd IAEA Technical Committee Meeting on Steady State Operation of Mag- neticFusionDevice,Fukuoka,Japan,25–29October1999. [5] N. Ravi Prakash, P. Chaudliuri et al., Proceedings of the 21st Symposium on Fusion Technology, Madrid, Spain, 11–15 September 2000. [6] ANSYS Revision 5.2 User’s Manual, Swanson Analysis Systems Inc, USA, 1995. [7] R. Siegel, J.R. Howel, Thermal Radiation Heat Transfer, Hemisphere, New York, 1983, pp. 202–210 Chapter 7. [8] M.F. Modest, Radiative Heat Transfer, McGraw-Hill, New York, 1993. [9] S. Maruyama, Radiation heat transfer between 3-D bodies with specular and diffuse surfaces, Numerical Heat Trans- fer, Part A 24 (1993) 181–196. [10] W.H. Adams, Heat Transmission, 3rd ed., McGraw-Hill, New York, 1954. [11] R.A. Howard, et al., Engineering Design Manual, Vol. 1, p. 17. UCAR Carbon Inc., USA. [12] K. Redler, TPX Memo No. TPX:GA:0124:KR:95, File 13.0. [13] F.P. Incorpera, D.P. Dewitt, Fundamentals of Heat and Mass Transfer, John Wiley & Sons, Inc., New York, 3rd ed., 1990. [14] M.N. Ozisic, Heat Transfer: A Basic Approach, McGraw- Hill, New York, 1985, pp. 300–340. [15] NIST Standard Reference Database 12 (NIST Thermody- namic and Transport Properties of Pure Fluids—NIST pure fluids), National Institute of Standards and Technol- ogy. [16] P. Karditgas, Thermal and structural behavior of various first wall components, Fusion Eng. Design 25 (1994) 273–287.