Download
1 / 24
240 likes | 613 Vues
Aquatic Ecology 303-47900. metrics (quantitative representation of community) species/taxa richness, diversity index Hilsenhoff Biotic Index (also, Family Biotic Index) each organism has a tolerance value sum (s i t i )/N where s = species, t = tolerance score

E N D
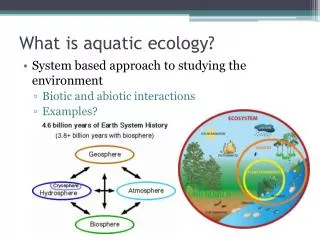
metrics (quantitative representation of community) species/taxa richness, diversity index Hilsenhoff Biotic Index (also, Family Biotic Index) each organism has a tolerance value sum (siti)/Nwhere s = species, t = tolerance score EPT index (# of families), %EPT focus on Ephemeroptera, Plecoptera, Trichoptera families EPT/chironomid abundances ratio scrapers to filter-feeders, or ratio shredders to total community structure
trade-off loss of precision & accuracy with lower cost quantitative vs. qualitative ID to order, family, or species? Hydropsyche sparna 6, H. phalerata 1, Parapsyche 0 variation among habitats within stream variance based on geography multimetrics: combining a number of metrics RPB - rapid bioassessment protocols standards based on bioregions use of reference streams problems with metrics:
multimetric: calculate a score based on a formula, compare it to score generated from reference streams from the region multivariate: construct a model based upon a large number of sites sampled and related through multivariate statistics multimetric vs. multivariate methods
multimetric: total abundance number of families % EPT individuals % Chironomidae # EPT indiv/(#EPT+chiron.) # hydropsych/#trichop %dominance Family Biotic Index (FBI) multivariate: BEAST (Benthic Assessment of Sediment) AusRivAS (Australian River Assessment Scheme)
comparison of precision and accuracy compared to classification
Oregon study: 6 sites, 43-58 samples/site ID to genus Classification Strength (CS) within site similarity vs. between site similarity larger is better determine relationships CS vs. # of surber samples CS vs. # of organisms sampled type of similarity index effect of sampling effort: multivariate models
magnitude of variation depends on type of biotic measure sampled 4 creeks within one catchment basin and ecoregion yearly over 4-5 years; used multimetric methods compared CV of single streams among years & multiple streams within year within year / among year variation
migration: periodic locomotion, not for daily maintenance dispersal: permanent change in location gene flow: change in gene pools (i.e., frequency of alleles) due to movement of individuals between populations migration, dispersal, gene flow
below the thermocline by day, migrate up nightly migration: zooplankton in lakes
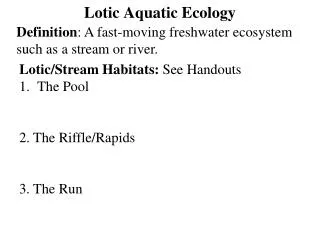
Drift: • downstream transport in the water column • primarily swept downstream by current • invertebrates, larval fish • short-duration association with water column • significant for • downstream dispersal • food source for suspension-feeders
periodicity • most drift occurs at night • peak just after dusk, may rise just before dawn
why drift at night? • avoid visual predators • after contact with night-active tactile predators • mechanism? • partially genetic, partially environmental
what types and proportions of the insects drift? study of 2 headwater streams: input vs. output <1% of annual mean density <4% of annual mean biomass <1% of annual invertebrate production of floodplains
most leaving in drift were copepods, chironomids, and ostracods (78-88% of individuals; net output) net input primarily mayflies, caddisflies, and isopods (misc. were primarily odonates and megalopterans)
dilema: how to compensate for drift dispersal • upstream crawling by juveniles • Leptophlebia sp. mayflies crawl 200 m / day, a total of 1.6 km • also contributes to initial colonization of streams • upstream crawling typically compensates for 2 - 15% of downstream drift dispersal • upstream flying by adults
what is most important for dispersal? • drift as juveniles or is flight by adults? • answer is obvious for crustaceans • studies in population genetics:
dispersal by freshwater shrimp (Paratya australiensis) live in Australian upland streams planktonic larvae drift, plus can walk upstream as adult examined allele frequencies (6 loci - only 1 shown) ca. 200 km between estuaries of these rivers large difference in genetic structure between streams, but not greater between 2 drainage systems
how effective is dispersal in stream insects? comparison with 3 types of Australian invertebrates Baetis sp. mayfly Rheumatometra sp. water strider Tasiagma sp. caddisfly data indicates limited within-stream movement, probably only a few females colonizing, but genetic blending over streams & catchments
permanent ponds: both metamorphic and paedomorphic salamanders temporary ponds: dispersal of fairy shrimp(study in the Rocky Mtns)
fairy shrimp eggs hatch: if passed through a salamander if live females or just egg sacs are put in a pond
population genetics of fairy shrimps: more similar within valleys than between valleys