Download
1 / 44
460 likes | 915 Vues
ICT and Power (Electricity). Prof. Rahul Tongia School of Computer Science CMU 17-899 Fall 2003. Topics for Discussion. Electricity and Development Power for ICT ICT for Power. Fundamentals. Electricity is a form of energy (kWh) Does not exist in usable forms

E N D
ICT and Power (Electricity) Prof. Rahul Tongia School of Computer Science CMU 17-899 Fall 2003
Topics for Discussion • Electricity and Development • Power for ICT • ICT for Power
Fundamentals • Electricity is a form of energy (kWh) • Does not exist in usable forms • Conversion usually requires prime movers (steam turbines, water turbines, etc.) • Access to fuels (primary energy) is a key issue for developing countries • Electricity is only about 125 years old • Widespread use is much more recent • US required special programs • Rural Electrification Administration (REA) [now Rural Utilities Service] • TVA • Electricity from the grid can not be easily stored (AC) • Most electronics use DC
What’s Special about LDCs? • Very low levels of Electrification • 2 billion+ lack electricity • Bad quality, intermittent, and often expensive power if available • Lower Level of Economic Development • Large rural agricultural sector • Large quantities of crop residues: primary energy source • Special needs for agricultural services (e.g., pumping water ~ 1/3 of India’s electricity) • Heavily subsidized in many countries • Industrial-Political Organization • State-centered economies • State-owned enterprises (SOEs) handle not just power but much of the economy • Weak formal institutions • E.g., regulatory institutions, courts, corporate governance
Energy-Economy Correlation 1996 Calculated from EIA Data
(Lack of) Access to Electricity South Asia (India) Sub-Saharan Africa East Asia (China) Source: WEO 2002
Investments in LDC Power Sector Source: World Bank (2003)
Where Does Electricity Go? • US • ~ 1/3 residential, 1/3 industrial, 1/3 commercial • Developing Countries • Varies significantly by country • Typically higher shares for non-residential (function of large, centralized design) • Grid penetration to rural areas is very low • Kenya used to have more homes served by Decentralized Generation (DG) than the grid (mainly solar) In reality, a fair amount is lost along the way, or stolen!
Electricity in LDCs Source: World Bank (2003)
How Much Electricity Does ICT Use? • Numbers as high as 13% of US electricity were claimed • End users, servers, networking, etc. • Later debunked • ICT – Energy (Power) linkages • Greater Service Economy, even in developing countries • But, increased globalization
What Consumes Power (ICT Applications)? • Components of an ICT solution • Computing • Display • CRT 80 W normal 10 W suspend • LCD 15-25 W normal 5-10 W suspend • Storage variable • Uplinking 12 W Wifi 40 W VSAT • Role of advanced technologies • Chips (processor is largest component) • Pentium 4 uses 50+ watts! • LCD screens, OLEDs, etc. • Wireless • Cognitive Radios – reduce power to lowest required level • But, emitted power is << power drawn from supply • 100 mW is legal limit for WiFi • Laptops – much less power but less robust (?)
Details of Desktop Power SCSI CD-RW Drive - 17W SCSI CD-ROM Drive - 12W 5400RPM IDE Hard Drive - 10W 7200RPM IDE Hard Drive - 13W 7200RPM SCSI Hard Drive - 24W 10000RPM SCSI Hard Drive - 30W Floppy Drive - 5W Network Card - 4W Modem - 5W Sound Card - 5W SCSI Controller Card - 20W Firewire/USB Controller Card - 10W Case Fan - 3W CPU Fan - 3W AGP video card - 20-30W PCI video card - 20W AMD Athlon 900MHz-1.1GHz - 50W AMD Athlon 1.2MHz-1.4GHz - 55-65W Intel Pentium III 800MHz-1.26GHz - 30W Intel Pentium 4 1.4GHz-1.7GHz - 65W Intel Pentium 4 1.8GHz-2.0GHz - 75W Intel Celeron 700MHz-900MHz - 25W Intel Celeron 1.0GHz-1.1GHz - 35W ATX Motherboard - 30W-40W 128MB RAM - 10W 256MB RAM - 20W 12X or higher IDE CD-RW Drive - 25W 32X or higher IDE CD-ROM Drive - 20W 10x or higher IDE DVD-ROM Drive - 20W Source: FLECOM
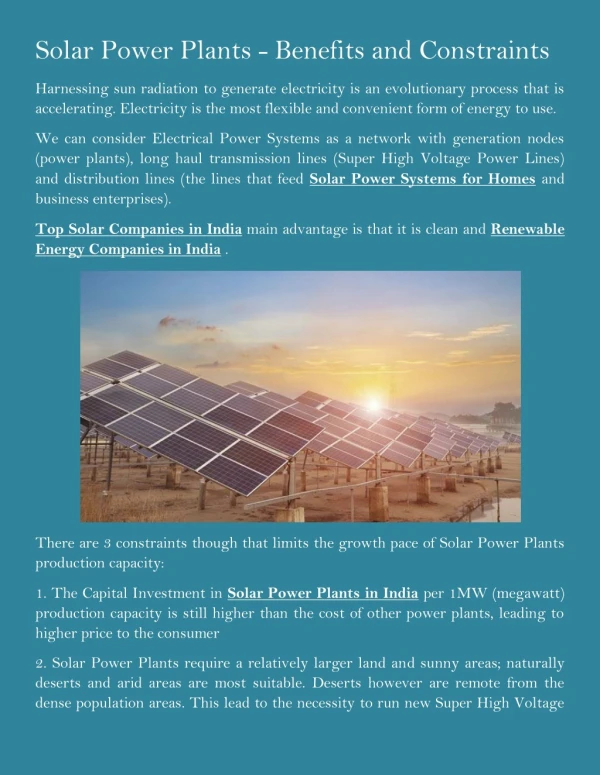
Standalone (DG) Power • What are the options if If AC power is unavailable? • Backup or primary supply? • Non-Conventional Sources of Power • Issues of Scale • For ICT or more (single point or village level)? • Local availability • Solar • Only 3-5 hours equivalent per day (1 kW INPUT/m2 of panel; ~10% efficiency) • Wind • Windspeeds vary by location; highest efficiency for megawatt class turbines • Biomass • Conversion options limited, typically require tens of kW size • Microhydel • Location sensitive, and typically 10s of kW • Diesel • Expensive to run, typically AC output
Designing a DG system • Battery Life examples • Alkaline (from Duracell) NOMINAL VOLTAGE (volts) RATED CAPACITY (ampere-hours) D 1.5 15 C 1.5 7.8 AA 1.5 2.85 AAA 1.5 1.15 Gets very expensive, quickly, even if rechargeable • Lead-acid batteries give much more power and are standardized • Limits on dischargeability - ~20 kWh total charge • Matching supply to demand • AC grid –“infinitely” flexible • Power storage is key • Else peak capacities must be matched • Intermittency issues for many DG systems • Theft is a major concern for DG design (!)
Designing a DG system (cont.) • Solar Systems • Components • PV modules (in series, in panel form) • Power Conditioning Equipment (economies of scale) • Housing (with or without directionalizing)/mounting • Batteries – most expensive operating costs* • Inverter – if AC is required • Costs • Capex at small scale is ~5/peak watt • Gives an operating cost around 20-30 cents/kWh * cell phone example – Obsolescence of equipment vs. battery
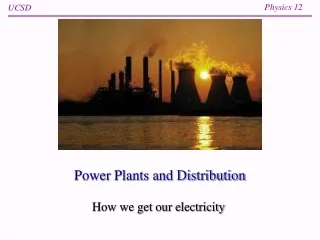
ICT for Electricity Systems • Two main issues • Supply << Demand • Requires investments of billions • Ability to pay is limited • Often, power companies are loss-making; some of that is inefficiency • Where can ICT contribute? • Components of power sector vertical • Generation • Transmission • Distribution • Consumption
Conventional Wisdom • One can not do real-time power flow management (transactions and billing) for transmission level flows • Today, pools operate based on historical or aggregated information • One can not measure demand (usage) from all consumers in real-time with high granularity What has changed to make these outdated – the growth of IT technology
Focus here on Distribution/Consumption • IT is already extensively used in generation/transmission in developed countries • Other Synergies • Stringing Optical Fibers along power lines • Smart Cards (pre-payment) • Found extensive use in S. Africa in Black Townships (12 years experience) • Can link to other utilities or consumer services (pre-paid cell-phone cards are very popular)
Using IT to Enable Sustainability • Sustainability has many components • Resource utilization • Efficiency and loss reduction are sine-qui-non • Economic viability • Theft reduction • Management • IT can improve power sector distribution, consumption (utilization), and quality of service • Requires a change in mindset, and the willingness of utilities to innovate
Case study on IT for power sector improvement in India • India today has the world’s largest number of persons lacking electricity • 400 million (equivalent to Africa’s unserved!) • Reforms began in 1991 • Vertically integrated government department monopolies are being broken • Initial focus was on generation • New realization that distribution is the key to India’s power sector viability • Newer entities should be run as businesses Many parallels to other developing countries
India’s Power Sector Overview • 5th largest in the world – 107,000+ MW of capacity • But, per capita consumption is very low • 350 kWh, vs. world average over 2,000 kWh • 40% of households (60% of rural HH) lack electricity • In very dire straits • Supply << Demand • Blackouts are common, with shortfall estimated between 10-15% • Most utilities are heavily loss-making, with an average rate of return of negative 30% or worse (on asset base) • High levels of losses = 25+% • Technical losses – poor design and operation • Commercial losses (aka theft) often over 10%
Reasons for the problems • Agricultural sector • Consumes 1/3 of the power, provides <5% of revenues • Pumpsets are overwhelmingly unmetered – just pay flat rate based on pump size • Adds to uncertainty in technical losses vs. commercial losses and usage • Utilities lack load duration curves to optimize generation and utilize Demand Side Management • All generation is assumed to be baseload, and priced accordingly • Leads to poor energy supply portfolio • Doesn’t send correct signals to consumers, either • Utilities end up using just average costing numbers, not recognizing the marginal costs
Idea – use IT for power sector management • Posit – If new meters are to be installed, why not “smart” digital meters, which are also controllable, and communications-enabled? • Incremental costs would be low • Instead of just quantity of power, can also improve quality of power • Analysis presented is based on collaborative work with a major utility in India (name withheld for confidentiality reasons)
Quality of Power • India is focusing on quantity of power only • Current “shortfall” numbers are contrived • Based only on loadshedding with minor correction for frequency • Do no factor in peak clipping fully • Do not account for lack of access (e.g., over 60% of rural homes lack connections) • Quality norms are often missed • Voltage – often deviates by 25+% • Frequency – often deviates by 5% (!) • Even farmers pay a lot for their bad quality power (around 1 cent/kWh implicit, even higher in some regions) • Use of voltage stabilizing equipment • Additional capital costs (in the multiple percent range) • Efficiency losses (2-30% lost!)
Why the Focus on Distribution? • It’s where the consumer (and hence, revenue) is • High losses today • Technical losses, 10+ % in rural areas • DSM and efficiency measures possible • Use of standards required • Use a combination of technology, industrial partnership, and regulations • Learn from experiences elsewhere • Bulk of India's consumption is for just several classes of devices • Pumpsets • Refrigerators • Synchronous motors • Heating (?)
US Refrigerator Efficiency Standards Similar standards can be established for “smart appliances” Source: www.standardsasap.org
Future of Appliances and Home Energy Automation Networks • Incremental cost of putting networking and processors into appliances approaching a few dollars • Could allow time of use and full control (utility benefit/public good/user convenience) • Link to a smart distribution system • Micro-monitor and Micro-manage every kWh over the network • E.g., refrigerators – don’t operate or defrost during peaks (5% of Indian electricity usage) • 5% peak load management could lead to a 20% cost reduction • Feasible, as most peak loads are consumer-interfaced • Bimodal peaks in India, residential driven • Italy is already implementing such a system (ENEL)
Objectives and design goals for a new IT-enabled • Implement a basic infrastructure to… • Micro-measure every unit of power across the network • Allow real-time information and operating control • Devise mechanisms to control the misuse and theft of power through soft control • Which would… • Reduce losses • Improve power quality • Allow load management • Allow system-level optimization for reduced costs • Increase consumer utility, satisfaction, and willingness to pay
Additional Benefits • A system which will offer • Outage detection and isolation • Remote customer connect & disconnect • Theft and tamper detection • Real time flows • To allow real time pricing • Suitability for prepayment schemes • Load profiling and forecasting • Possible advanced communications and services • Information and Internet access • Appliance monitoring and control • Managing such “extra” power (from theft) is enough to give subsistence connectivity to the poor • Requires ICT to determine and manage the margin effectively • Telecom is special – very short-run low marginal cost; in electricity it is much more difficult
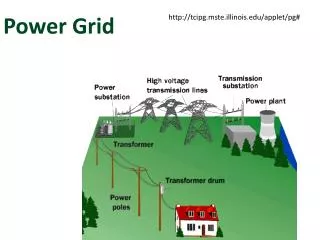
Data Center Network Schematic Last Few Hundred Meters ~ 20 km Couple Coupler Uplink r Coupler House Secondary LV Concentrator Distribution House Voltage Coupler Distribution Transformer (pole or ground) Sub-Transmission and Transmission Substation Users Smart Meter (Can be off-site outside user Control; Is partly a modem) (> 11 kV) Access (440, 220, or 110 V) Low Voltage Distribution (~11 kV) Medium Voltage
Components of the solution • One segmentation – locational • At consumer • Meter/Gateway • Meter could be pole-side if required • In home network • Needed connect to enabled devices (appliances) • Eventually, homes would also have Decentralized Generation available (?fuel cells, flywheel storage, etc.) • Access (low voltage distribution) • From gateway to a concentrator, on user side of distribution transformers – Using PowerLine Carrier (PLC)
Solution Components (Cont.) • Concentrator upwards • Concentrator – Each Distribution Transformer (aka Low Voltage Transformer) feeds on the order of 100-200 homes in India (as in Europe). In contrast, US Distribution Transformers feed 5-10 users. • Communications medium • Over Medium Voltage PLC to the Sub-station or • Wireless • Limited Coverage in Developing Countries • Substation upwards (uplinking) • Usually based on leased lines or optical fiber
Technologies for various segments • In-Home Network • Appliances • Emerging Standards are talked about by appliance companies (Maytag, Samsung, GE, Ariston etc.) • Using Simple Control Protocol (or other appropriate “thin” protocols) • Meters • Solid-State meters exist, but not yet the norm in developing countries • Most have communications capabilities for external ports • Lowest cost solution (if feasible) – PLC – target 5$ incremental cost
Technologies for various segments (cont.) • Access • Low Voltage PLC is available today • Being explored for Internet access, in fact (Megabits per second) • MV • Crossing through transformers remains a technical challenge • Going long distances an issue • Uplinking • Availability of optical fiber or leased lines can be met through planning
Design Model and Business Case • Only target specific users • All agricultural (almost one-third of the load) • All Industrial and larger commercial users • Only the larger-size domestic users • Estimated 2/3 of homes only use <50 kWh per month • Include every network node that needs monitoring and/or control • Substations • Transformers • Capacitor banks • Relays etc.
Design Model and Business Case (cont.) • Investment in long run only a few thousand rupees per targeted user (Target <75$ capex) • When amortized, implies requirement of improvements in system of only a few percent! • Savings will come from • Lower losses/theft • Increased sales possible • Lower operational costs • Load management • Better consumer experience (and hence, possibility for higher tariffs) • Future interaction with smart appliance and smart home networks • Possibly new services
Economics of case system • Estimated System (Rural-centric) • 62 Consumers (all classes) per Distr. Transformer • 98 Distribution Transformers per Sub-Station
Economics (cont.) • 6-7 year payback on investment (conservative) possible with just 3% improvement in system • Savings will come from • Theft Reduction • Time-of-Day and DSM measures (peak reduction) • System Quality, reliability, and uptime • Higher Collection
Challenges • Protocols • Use of thin protocols to reduce capex for embedded systems • Security – PLC can be a shared medium • PLC • How to couple around transformers or other obstacles • How to go long runs with low errors (and high enough bandwidth) – Shannon’s theorem provides a limit • Noisy line conditions in many developing countries • Appliances • Need for standards to bring down costs and ensure inter-operability • Design – Should the PLC signals pass through the meter/gateway directly to appliances? • How active or passive should consumer behavior modification be? • Costs (as always)
Challenges – Implementation and Management • Utilities are typically risk-averse • They face increased regulatory uncertainty • Without some portions of a market, how do they benefit? • Will they (should they) pass all pricing information on to the consumer? • Developing country management issues • Utilities were typically State Owned Enterprises (SOEs) • Utilities were run with social engineering goals • Increased automation, control, and sophistication (and theft detection) poses risks to the large cadre of current employees
A New World for Power Systems • Includes “smarts” for significant improvements in efficiency • New services can be enabled once the appropriate infrastructure is in place • Segmentation of development allows independent, modular innovation, e.g., home automation and appliances • Developing countries (esp. Asia) can lead the way through leap-frogging