Download

1 / 17
170 likes | 325 Vues
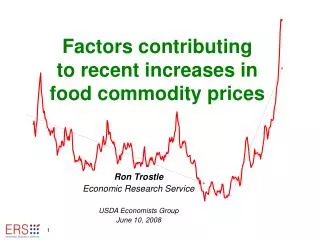
Increases in Global Commodity Prices: Macroeconomic Effects and Policy Responses of Developing Countries. Prof. Jeffrey Frankel APPENDICES V Jornada Monetaria, Banco Central de Bolivia Crisis Alimentaria, Inflación y Respuestos de Política 18 July, 2011, La Paz. July 14 draft.

E N D
Increases in Global Commodity Prices: Macroeconomic Effectsand Policy Responses of Developing Countries Prof. Jeffrey Frankel APPENDICES V Jornada Monetaria, Banco Central de Bolivia Crisis Alimentaria, Inflación y Respuestos de Política 18 July, 2011, La Paz July 14 draft
Appendices • Appendix I • References • Food price graph • Update of commodity-interest rate test • Appendix II:Simulations of the implications of PPT, compared to 6 other nominal anchors
The presentation draws on these references by the author • "The Effect of Monetary Policy on Real Commodity Prices"in Asset Prices and Monetary Policy, J.Campbell, ed. (U.Chicago Press, 2008): 291-327. • “The Natural Resource Curse: A Survey,” forthcoming in Beyond the Resource Curse, B.Shaffer, ed.(U.Penn.Press, 2011). NBER WP 15836. CID WP195. • “A Comparison of Product Price Targeting and other Monetary Anchor Options, for Commodity-Exporters in Latin America,"Economia, journal of LACEA, 2011. NBER WP 16362. • “How Can Commodity Exporters Make Fiscal and Monetary Policy Less Procyclical?” forthcoming, Natural Resources, Finance and Development, R.Arezki, T.Gylfason & A.Sy, eds. (IMF, 2011). HKS RWP 11-015. • “Combating Agricultural Price Volatility,” Project Syndicate, June 27, 2011.
The recent levels in food prices, though high, have not been as high as 1974 in real terms. Nominal prices2010=100 Real prices * = nominal in 2000
If 2008-2010 is added to the regression of real commodity prices against real interest rates(alone), • the relationship weakens a bit. • R2 falls to .26; • Coefficient is -9.4; t-statistic is still -18.6. Real $ commodityprice index(Moody’s, excl.oil) A.Saiki, DNB 1951-2010 Real US interest rate
Appendix 2 • Simulations of ability of PPT to stabilize the real prices of traded goods, • relative to CPI targeting • or exchange rate targets • or historical status quo.
Price of aluminum in JamaicaSimulations under 6 alternative anchors Jamaica 1) Any nominal target would have eliminated high 1970s inflation. 2) PPI target stabilizes domesticaluminumprice betterthandoesCPI.
Table 4: Variability of Export Prices under Alternative Currency Regimes(a) Standard Deviation of Nominal Export Prices
Historical $ € SDR commodity CPI PPI peg peg peg peg peg peg
Begin with a hypothetical peg to the $. • In the case of Panama, same as historical peg. • In the other cases, we can simulate precisely what the price of copper, soy, etc. would have been in terms of pesos under the counterfactual, • by using the historical series for the peso/$ exchange rate: • if the peso historically depreciated against the $ by 1% in some given month, we know the price of copper would have been lower by precisely 1% if the peso had instead been pegged to the $. • In general, the $ pegs would have produced far more stable prices in domestic terms. • This is also true of the other 5 nominal anchors, and just illustrates the tremendous price instability experienced in the 1970s & 80s. • Changes in prices are also more stable under the anchors(Table 4b).
The middle two columns of Table 4a show what variability of the commodity export prices would have been under an SDR peg or € peg, respectively. • Variability of the domestic price of the commodity export is often lower under the € peg than under the $ peg: for natural gas & oil; iron & steel; copper, aluminum & gold; bananas & sugar; and soy & beef. • A point often missed by observers who read too much into the $-invoicing of international commodity trade: • Although the use of the $ may introduce some dollar-stickiness in the very short run, it does not carry over to the medium run. • When the effective foreign exchange value of the $ rises, $ prices of these commodities tend to fall quickly. • The offset is not fully proportionate; but the point is that the prices are not more stable in terms of $ than in terms of €. • Table 4(a) shows that in some cases (soy, coffee & beef), the SDR basket would stabilize commodity prices better than either the $ or €.
The last two columns in the tables: comparison of effects of a PPI target & a CPI target,which is intended as the contribution of Frankel (2011). • Comparison in terms of ability to stabilize domestic price of the principle export commodity (Table 4a): • The standard deviation of the domestic price of the export commodity is usually lower under PPT than under the CPI target. • In a few cases, it is less than half the size: • Jamaica for aluminum & Uruguay for beef.
Stabilizing domestic prices with respect to the export commodity is far from the only criterion that should be considered in comparing alternative candidates for nominal anchor. • Another one is stabilizing domestic prices of other tradable goods. • A valid critique of PEP was that it transfers uncertainty that would otherwise occur in the real price of commodity exports into uncertainty in the real price of non-commodity exportables and importables. • This critique is particularly relevant if diversification of the economy is valued. • In Table 5 we conduct simulations for the domestic prices of import goods, under the same seven alternative regimes.
Table 6 shows implications of the alternative regimes, for an objective function that is a weighted average of • the standard deviation of the real price of the commodity export • and the standard deviationof thereal price of theimport good.
Real Prices** Historical Dollar Comm. CPI PPI SDR Peg Euro Peg Regime Peg Peg Target Target ARG 0.661 0.491 0.503 0.486 0.241 0.756 0.679 BOL 0.538 0.443 0.457 0.486 0.138 0.488 0.448 BRA 0.522 0.456 0.442 0.426 0.187 -- -- CHL 0.510 0.485 0.489 0.470 0.298 0.840 0.696 COL 0.456 0.485 0.482 0.490 0.000 1.123 0.974 CRI 0.420 0.368 0.383 0.385 0.242 -- -- ECU 0.456 0.485 0.482 0.490 0.000 -- -- GTM 0.510 0.588 0.600 0.585 0.383 -- -- GUY 0.922 0.581 0.579 0.557 0.383 -- -- HND 0.533 0.588 0.600 0.585 0.383 -- -- JAM 0.338 0.383 0.401 0.403 0.212 0.870 0.483 MEX 0.479 0.485 0.482 0.490 0.000 0.975 1.030 NIC 0.511 0.588 0.600 0.585 0.339 -- -- PAN 0.312 0.368 0.383 0.385 0.206 -- -- PER 0.444 0.485 0.489 0.470 0.171 0.420 0.429 PRY 0.413 0.455 0.475 0.466 0.312 0.743 0.716 SLV 0.750 0.588 0.600 0.585 0.383 -- -- TTO 0.383 0.443 0.457 0.486 0.179 -- -- URY 0.504 0.455 0.475 0.466 0.312 0.793 0.525 VEN 0.429 0.485 0.482 0.490 0.000 -- -- Average of leading commodity export standard deviation & oil price standard deviation. Table (6c): Standard Deviation of Real PricesExport Price SD & Import Price SD Averaged Real prices of TGs in general would be more stable under PPI target than CPI target.
Theexportpricetarget winsthecompetition to reduce relative price variability PPT • by a margin • when we look at the level of nominal prices (Table 6a) • or the level of real prices (Table 6c) ; and • by a smaller margin when we look at nominal price changes(Table 6b). • The three currency pegs are again similar to each other, showing less price variability than the historical regime but more than the commodity peg. • The PPI target usually gives less relative price variability than the CPI target. • Looking at real price variability in Table 6c, • the only exception is Peru; • the gain is substantial in the case of Jamaica and Uruguay, • smaller for the others.