Download
1 / 72
760 likes | 1.95k Vues
Risk, Return, Portfolio Theory and CAPM . TIP If you do not understand anything, ask me!. Where does the discount rate (for stock valuation) come from?. So far,. We have taken the discount rate as given.

E N D
Risk, Return, Portfolio Theory and CAPM TIP If you do not understand anything, ask me! Where does the discount rate (for stock valuation) come from?
So far, • We have taken the discount rate as given. • We have also learned the factors that determine the discount rate in bond valuation. • What is the appropriate discount rate in stock valuation?
Topics • Risk and returns • 75 Years of Capital Market History • How to measuring risk • Individual security risk • Portfolio risk • Diversification • Unique risk • Systematic risk or market risk • Measure market risk: beta • CAPM
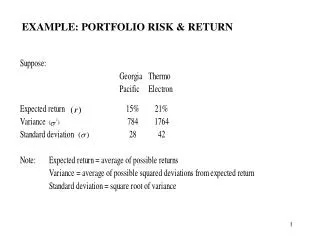
The Value of an Investment of $1 in 1926 6402 2587 64.1 48.9 16.6 Index 1 Year End Source: Ibbotson Associates
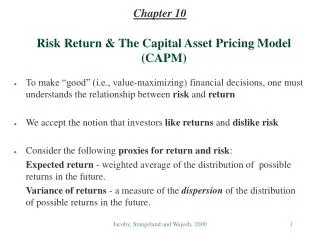
The Value of an Investment of $1 in 1926 Real returns 660 267 6.6 5.0 1.7 Index 1 Year End Source: Ibbotson Associates
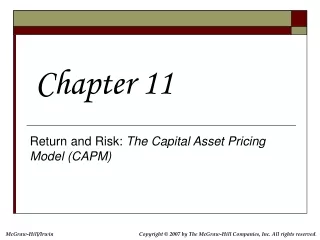
Rates of Return 1926-2000 Percentage Return Year Source: Ibbotson Associates
Selected Realized Returns, 1926 – 2001 Average Standard ReturnDeviation Small-company stocks 17.3% 33.2% Large-company stocks 12.7 20.2 L-T corporate bonds 6.1 8.6 L-T government bonds 5.7 9.4 U.S. Treasury bills 3.9 3.2 Source: Ibbotson Associates.
Risk premium • Risk aversion – in Finance we assume investors dislike risk, so when they invest in risky securities, they require a higher expected rate of return to encourage them to bear the risk. • The risk premium is the difference between the expected rate of return on a risky security and the expected rate of return on a risk-free security, e.g., T-bills. • Over the last century, the average risk premium is about 7% for stocks.
Measuring Risks • How to measure the risk of a security? • Stand-alone risk: when the return is analyzed in isolation. This provides a starting point. • Portfolio risk: when the return is analyzed in a portfolio. This is what matters in reality when people hold portfolios.
PART I: Standard alone risk • The risk an investor would face if s/he held only one asset. • Investment risk is related to the probability of earning a low or negative actual return. • The greater the chance of lower than expected or negative returns, the riskier the investment. • The greater the range of possible events that can occur, the greater the risk
Firm X Firm Y Rate of Return (%) -70 0 15 100 Expected Rate of Return Probability distributions Which firm is more likely to have a return closer to its expected value? • A listing of all possible outcomes, and the probability of each occurrence. • Can be shown graphically.
Measuring Risk In financial markets, we use the volatility of a security return to measure its risk. Variance – Weighted average value of squared deviations from mean. Standard Deviation – Squared root of variance.
Some basic concepts • Some basic formula for Expectation and Variance • Let X be a return of a security in the next period. Then we have
Return: Calculating the expected return for each alternative
Risk: Calculating the standard deviation for each alternative
Comments on standard deviation as a measure of risk • Standard deviation (σi) measures “total”, or stand-alone, risk. • The larger the σi , the lower the probability that actual returns will be closer to expected returns, that is : the larger the stand-alone risk.
PART II: Risk in a portfolio context • Portfolio risk is more important because in reality no one holds just one single asset. • The risk & return of an individual security should be analyzed in terms of how this asset contributes the risk and return of the whole portfolio being held.
Portfolio • A portfolio is a set of securities and can be regarded as a security. • If you invest W dollars in a portfolio of n securities, let Wi be the money invested in security i, then the portfolio weight on stock i is , with property
Example 1 • Suppose that you want to invest $1,000 in a portfolio of IBM and GE. You spend $200 on IBM and the other $800 on GE. What is the portfolio weight on each stock?
In a portfolio… • In English, we say: • The expected return = weighted average of each stock’s expected return. • But the portfolio standard deviation is <= the weighted average of each stock’s standard deviation. • I Mathematics, we say:
(Not required) Suppose a portfolio is made up of x1 shares of stock 1 and x2 shares of stock 2.
Suppose you invest 50% in HT and 50% in Coll. What are the expected returns and standard deviation for the 2-stock portfolio?
An alternative method for determining portfolio expected return
Comments on portfolio risk measures • σp = 3.3% is lower than the weighted average of HT and Coll.’s σ (16.7%). This is true so long as the two stocks’ returns are not perfectly positively correlated. • Perfect correlation means the returns of two stocks will move exactly in same rhythm. • Portfolio provides average return of component stocks, but lower than average risk. • The more negatively correlated the two stocks, the more dramatic reduction in portfolio standard deviation.
Stock W Stock M Portfolio WM 25 15 0 0 0 -10 -10 Returns distribution for two perfectly negatively correlated stocks (ρ = -1.0) 25 25 15 15 -10
Stock M’ Portfolio MM’ Stock M 25 25 25 15 15 15 0 0 0 -10 -10 -10 Returns distribution for two perfectly positively correlated stocks (ρ = 1.0)
General comments about risk • Most stocks are positively correlated with the market (ρk,m 0.65). • σ 35% for an average stock. • Combining stocks in a portfolio generally lowers risk.
Total Risk • A stock’s realized return is often different from its expected return. • Total return= expected return + unexpected return • Unexpected return=systematic portion + unsystematic portion • Thus: Total return= expected return +systematic portion + unsystematic portion • Total risk (stand-alone risk)= systematic portion + unsystematic portion
Systematic Risk • Total risk (stand-alone risk)= systematic portion + unsystematic portion • The systematic portion will be affected by factors such as changes in GDP, inflation, interest rates, etc. • This portion is not diversifiable because the factor will affect all stocks in the market. • Such risk factors affect a large number of stocks. Also called Market risk, non-diversifiable risk, beta risk.
Unsystematic Risk • Total risk (stand-alone risk)= systematic portion + unsystematic portion • This portion is affected by factors such as labor strikes, part shortages, etc, that will only affect a specific firm, or a small number of firms. • Also called diversifiable risk, firm specific risk.
Diversification • Portfolio diversification is the investment in several different classes or sectors of stocks. • Diversification is not just holding a lot of stocks. • For example, if you hold 50 internet stocks, you are not well diversified.
Creating a portfolio:Beginning with one stock and adding randomly selected stocks to portfolio • σp decreases in general as stocks added. • Expected return of the portfolio would remain relatively constant. • Diversification can substantially reduce the variability of returns with out an equivalent reduction in expected returns. • Eventually the diversification benefits of adding more stocks dissipates (after about 10 stocks), and for large stock portfolios, σp tends to converge to 20%.
sp (%) Company-Specific Risk 35 Stand-Alone Risk, sp 20 0 Market Risk 10 20 30 40 2,000+ # Stocks in Portfolio Illustrating diversification effects of a stock portfolio
Breaking down sources of total risk Total risk= systematic portion (market risk) + unsystematic portion (firm-specific risk) • Market risk (systematic risk, non-diversifiable risk, beta risk) – portion of a security’s stand-alone risk that cannot be eliminated through diversification. It is affected by economy-wide sources of risk that affect the overall stock market. • Firm-specific risk (unsystematic risk, diversifiable risk, idiosyncratic risk) – portion of a security’s stand-alone risk that can be eliminated through proper diversification. • If a portfolio is well diversified, unsystematic is very small. Rational, risk-averse investors are just concerned with portfolio standard deviation σp, which is based upon market risk. That is: investor care little about a stock’s firm–specific risk.
How do we measure a tock’s systematic (market) risk? Beta • Measures a stock’s market risk, and shows a stock’s volatility relative to the market (i.e., degree of co-movement with the market return.) • Indicates how risky a stock is if the stock is held in a well-diversified portfolio.
Calculating betas • Run a regression of past returns of a security against past market returns. • Market return is the return of market portfolio. • Market Portfolio - Portfolio of all assets in the economy. In practice, a broad stock market index, such as the S&P Composite, is used to represent the market. • The slope of the regression line (called the security’s characteristic line) is defined as the beta for the security.
_ ki . 20 15 10 5 . Year kM ki 1 15% 18% 2 -5 -10 3 12 16 _ -5 0 5 10 15 20 kM Regression line: ki = -2.59 + 1.44 kM . -5 -10 ^ ^ Illustrating the calculation of beta (security’s characteristic line)
Security Character Line • What does the slope of SCL mean? • Beta • What variable is in the horizontal line? • Market return. • The steeper the line, the more sensitive the stock’s return relative to the market return, that is, the greater the beta.
Comments on beta • A stock with a Beta of 0 has no systematic risk • A stock with a Beta of 1 has systematic risk equal to the “typical” stock in the marketplace • A stock with a Beta greater than 1 has systematic risk greater than the “typical” stock in the marketplace • A stock with a Beta less than 1 has systematic risk less than the “typical” stock in the marketplace • The market return has a beta=1 (why?). • Most stocks have betas in the range of 0.5 to 1.5.
Can the beta of a security be negative? • Yes, if the correlation between Stock i and the market is negative. • If the correlation is negative, the regression line would slope downward, and the beta would be negative. • However, a negative beta is very rare. • A stock with negative beta will give your higher return in recession and hence is more valuable to investors, thus required rate of return is lower.
_ ki HT: β = 1.30 40 20 T-bills: β = 0 _ kM -20 0 20 40 Coll: β = -0.87 -20 Beta coefficients for HT, Coll, and T-Bills
Comparing expected return and beta coefficients SecurityExp. Ret. Beta HT 17.4% 1.30 Market 15.0 1.00 USR 13.8 0.89 T-Bills 8.0 0.00 Coll. 1.7 -0.87 Riskier securities have higher returns, so the rank order is OK.
Until now... • We argued that well-diversified investors only cares about a stock’s systematic risk (measured by beta). • The higher the systematic risk, the higher the rate of return investors will require to compensate them for bearing the risk. • This extra return above risk free rate that investors require for bearing the non-diversifiable risk of a stock is called risk premium.
Beta and risk premium • That is: the higher the systematic risk (measured by beta), the greater the reward (measured by risk premium). • risk premium =expected return - risk free rate. • In equilibrium, all stocks must have the same reward to systematic risk ratio. • For any stock i and stock m: • (ri-rf)/beta(i)=(rm-rf)/beta(m)