Download
1 / 38
380 likes | 715 Vues
Intermediate methods in observational epidemiology 2008. Quality Assurance and Quality Control. Threats to Causal Inference in Epidemiologic Studies. Threat. Solution. Experimental Design Adjustment/Control. Confounding. Quality Assurance Quality Control. Bias.

E N D
Intermediate methods in observational epidemiology 2008 Quality Assurance and Quality Control
Threats to Causal Inference in Epidemiologic Studies Threat Solution • Experimental Design • Adjustment/Control Confounding • Quality Assurance • Quality Control Bias
Definitions of Quality Assurance and Quality Control QA: Activities to assure quality of data that take place prior to data collection (through protocol and manuals of operation) QC: Efforts during the study to monitor the quality of data at identified points during the collection and processing of data
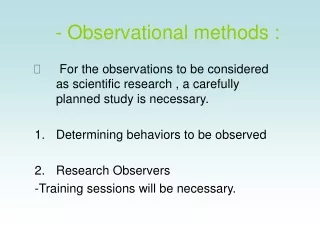
STEPS IN QUALITY ASSURANCE (1) Specify hypothesi(e)s (2) Specify general design -- develop protocol (3) Select or prepare data collection instruments, and develop procedures for data collection/ processing -- develop operation manuals (4) Train staff -- certify staff (5) Using certified staff, pre-test and pilot study instruments and procedures. In the pilot study, assess alternative strategies for data collection- eg, telephone vs. in-person interviews (6) Modify (2) and (3) and retrain staff on the basis of results of (5)
STEPS IN QUALITY ASSURANCE (1) Specify hypothesi(e)s (2) Specify general design -- develop protocol (3) Select or prepare data collection instruments, and develop procedures for data collection/ processing -- develop operation manuals (4) Train staff -- certify staff Based on a “grab” sample (5) Using certified staff, pre-test and pilot study instruments and procedures. In the pilot study, assess alternative strategies for data collection- eg, telephone vs. in-person interviews (6) Modify (2) and (3) and retrain staff on the basis of results of (5)
STEPS IN QUALITY ASSURANCE (1) Specify hypothesi(e)s (2) Specify general design -- develop protocol (3) Select or prepare data collection instruments, and develop procedures for data collection/ processing -- develop operation manuals Based on a sample as similar as possible to the study population (4) Train staff -- certify staff (5) Using certified staff, pre-test and pilot study instruments and procedures. In the pilot study, assess alternative strategies for data collection- eg, telephone vs. in-person interviews (6) Modify (2) and (3) and retrain staff on the basis of results of (5)
STEPS IN QUALITY ASSURANCE (1) Specify hypothesi(e)s (2) Specify general design -- develop protocol (3) Select or prepare data collection instruments, and develop procedures for data collection/ processing -- develop operation manuals (4) Train staff -- certify staff (5) Using certified staff, pre-test and pilot study instruments and procedures. In the pilot study, assess alternative strategies for data collection- eg, telephone vs. in-person interviews (6) Modify (2) and (3) and retrain staff on the basis of results of (5)
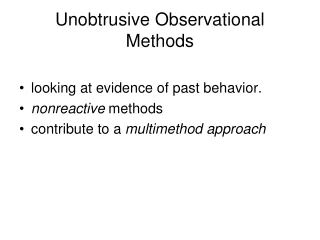
QUALITY CONTROL PROCEDURES: TYPES 1. Observation monitoring “Over the shoulder” observation of staff by experienced supervisor(s) to identify problems in the implementation of the protocol. Example: - Taping of interviews
QUALITY CONTROL PROCEDURES: TYPES 1. Observation monitoring 2. Quantitative monitoring variability • Random repeat (phantom) measurements based on either internal or external pools (biologic samples) to examine: • . Intra-observer • . Inter-observer • Advantages • . Better overall quality of data • . Measurement of reliability
Phantom sample based on an internal pool Aliquot 1: measurement in gold standard lab Aliquot 2: measurement in study lab Internal phantom sample STUDY BASE BLOOD SAMPLES OF 7 PARTICIPANTS
Phantom sample based on an external pool Aliquot 1: measurement in gold standard lab Aliquot 2: measurement in study lab STUDY BASE BLOOD SAMPLES OF 7 PARTICIPANTS Phantomsample from the gold standard lab
QUALITY CONTROL PROCEDURES: TYPES 1. Observation monitoring 2. Quantitative monitoring - Random repeat measurements • Monitoring of individual technicians for deviations from expected values • Example: monitoring of digit preference • for blood pressure (expected: 10% • for each digit)
Digit Preference in Systolic Blood Pressure (SBP) Measurements
Digit Preference in Systolic Blood Pressure (SBP) Measurements
Quality Control Indices • Validity (Accuracy) • Precision (Repeatability, Reliability)
Validity: Usually estimated by calculating sensitivity and specificity. The study (observed) measurement (“test”) is compared with a more accurate method (“gold standard”). When clearcut gold standard not available: “inter-method reliability” Problem: Limited to 2 x 2 tables
...Thus, traditional reliability indices (e.g., kappa, correlation coefficient) can be also used to estimate validity of continuous variables or variables with more than 2 categories • • • • • • • • Gold Standard results • • • • • • • Study results
Reliability: Sources of Variability • Measurement Error • Instrument/Technique/Lab • Observer/Technician • Intra-observer • Inter-observer • Intra-individual (physiologic)
Blood collected from the individual (replicate measurement) Repeat blood collection in same individual X time later Aliquot 1.1: Study lab determination Aliquot 1.2: Lab determination done by same technician Aliquot 1.2 Phantom sample Aliquot 1.2: measurement done by same technician in a masked fashion Aliquot 1.3: Lab determination done at a different lab Send Aliquot 1.3 to a different lab Aliquot 1.3 Aliquot 1.3: Lab determination done by a different technician at study lab Aliquot 1.2: measurement done by a different technician in a masked fashion at study lab Aliquot 1.4 Blood collected from an individual (1st measurement) To measure within-individual variability? To examine within-technician variability? For other sources of variability, use phantom samples To examine between-lab variability? To examine between-technician variability? Time Design of a study to evaluate sources of variability (Based on Chambless et al, Am J Epidemiol 1992;136:1069-1081)
Indices of Reliability (also used for validity) • % differences between repeat measurements (expected if no bias: ½ positive and ½ negative) • % observed agreement • Kappa • Correlation coefficient • Coefficient of variation • Bland-Altman plot
Indices of Reliability (also used for validity) • % differences between repeat measurements (expected if no bias: ½ positive and ½ negative) • % observed agreement • Kappa • Correlation coefficient • Coefficient of variation • Bland-Altman plot
First Reading Second Reading Plaque Normal Total Plaque 140 52 192 Normal 69 725 794 Total 209 777 986 Agreement Between First and Second Readings to Identify Atherosclerotic Plaque in the Left Carotid Bifurcation by B-Mode Ultrasound in the ARIC Study (Li et al, Ultrasound Med Biol 1996;22:791-9) Percent Observed Agreeement: [140 + 725] ÷ 986 = 88% • Shortcomings • Chance agreement is not taken into account • If most observations are in one of the concordance cell(s), % Observed Agreement overestimates agreement
First Reading Second Reading Plaque Normal Total Plaque 140 52 192 Normal 69 725 794 Total 209 777 986 Agreement Between First and Second Readings to Identify Atherosclerotic Plaque in the Left Carotid Bifurcation by B-Mode Ultrasound in the ARIC Study (Li et al, Ultrasound Med Biol 1996;22:791-9) Percent Observed Agreeement: [140 + 725] ÷ 986 = 88% • Shortcomings • Chance agreement is not taken into account • If most observations are in one of the concordance cell(s), % Observed Agreement overestimates agreement
Indices of Reliability (also used for validity) • % differences between repeat measurements (expected if no bias: ½ positive and ½ negative) • % observed agreement • Kappa • Correlation coefficient • Coefficient of variation • Bland-Altman plot
First Reading Second Reading Plaque Normal Total Plaque 140 52 192 Normal 69 725 794 Total 209 777 986 The most popular measure of agreement: Kappa Statistics PO Observed agreement proportion PE Expected (chance) agreement proportion
Kappa Statistics First Reading Second Reading Plaque Normal Total Plaque 140 52 192 Normal 69 725 794 Total 209 777 986 PO = [140 + 725] ÷ 986 = 0.88
Kappa Statistics First Reading Second Reading Plaque Normal Total Plaque 140 52 192 Normal 69 725 794 Total 209 777 986 PO = [140 + 725] ÷ 986 = 0.88 Expected agreement: (1) multiply the marginals converging on the concordance cells, (2) add the products, and (3) divide by the square of the total:
Kappa Statistics First Reading Second Reading Plaque Normal Total Plaque 140 52 192 Normal 69 725 794 Total 209 777 986 PO = [140 + 725] ÷ 986 = 0.88 Expected agreement: (1) multiply the marginals converging on the concordance cells, (2) add the products, and (3) divide by the square of the total:
Kappa Statistics First Reading Second Reading Plaque Normal Total Plaque 140 52 192 Normal 69 725 794 Total 209 777 986 Thus, kappa values obtained from different populations may not be comparable Agreement not due to chance Maximum agreement not due to chance PO = [140 + 725] ÷ 986 = 0.88 Expected agreement: (1) multiply the marginals converging on the concordance cells, (2) add the products, and (3) divide by the square of the total: PE = [(209 x 192) + (777 x 794)] ÷ 9862= 0.68 • Shortcomings • Kappa is a function of the prevalence of the condition • Can be calculated only for categorical variables (2 or more)
Interpretation of Kappa values 1.0 VERY GOOD 0.8 GOOD 0.6 MODERATE 0.4 FAIR 0.2 POOR 0 -1.0 (Altman & Bland, Statistician 1983;32:307-17)
Indices of Reliability (also used for validity) • % differences between repeat measurements (expected if no bias: ½ positive and ½ negative) • % observed agreement and % observed positive agreement • Kappa • Coefficient of variation • Bland-Altman plot
Coefficient of variation (CV) • General definition: Standard Deviation • (SD) as a percentage of the mean • value
For each pair of repeat measurements: Calculation of the Coefficient of Variability Xi1 and Xi2 = values of repeat measurements on same lab sample Xi = mean of these measurements For each pair of values: and The mean overall CV over all pairs is the average of all pair-wise CVs
Replicates (e.g., 2 different observers, 2 measurements done by same observer, 2 different labs, etc.) . . . . . . Example of Calculation of the Coefficient of Variation - I Phantoms PAIR No. 1 1 2 2 3 4 k
Replicates Example of Calculation of the Coefficient of Variation - I Phantoms PAIR No. Do the calculations for each pair of replicate samples 1 Pair (Split samples) No. 1: Measurement of total cholesterol 1 2 Measurement No. 1 (X11)= 154 mg/dL Measurement No. 2 (X12)= 148 mg/dL Repeat the calculation for all pairs of measurements and calculate average to obtain overall CV Mean= [154 + 148] / 2= 151 mg/dL V1= (154 - 151)2 + (148 - 151)2 = 18 mg/dL
Reliability in the ARIC study (Am J Epi 1992;136:1069) *Best: as high as possible **Best: as low as possible
Indices of Reliability (also used for validity) • % differences between repeat measurements (expected if no bias: ½ positive and ½ negative) • % observed agreement and % observed positive agreement • Kappa • Coefficient of variation • Bland-Altman plot