CEOP-AEGIS
CEOP-AEGIS. C oordinated Asia- E uropean long-term O bserving system of Qinghai–Tibet P lateau hydro-meteorological processes and the A sian-monsoon syst E m with G round satellite I mage data and numerical S imulations www.ceop-aegis.org.


CEOP-AEGIS
E N D
Presentation Transcript
CEOP-AEGIS Coordinated Asia-European long-term Observing system of Qinghai–Tibet Plateau hydro-meteorological processes and the Asian-monsoon systEm with Ground satellite Image data and numerical Simulations www.ceop-aegis.org Massimo MenentiDepartment of Earth Observation Systems, Delft University of Technology, The Netherlands Laboratoire des Sciences de l’Image, de l’Informatique et de la Télédétection - LSIIT, Universitè Louis Pasteur Illkirch, France 1st Progress Meeting - Milano June 29, July 2 2009
CEOP-AEGIS Objectives • Construct an observing system to determine and monitor the water yield of the Plateau • Incorporate existing ground measurements and current / future satellites • Requires estimating snowfall, rainfall, evapotranspiration and changes in soil moisture • Monitor the evolution of surface conditions and analyze the linkage with convective activity, precipitation events and the Asian Monsoon • Monitor snow, vegetation and surface fluxes as precursors of intense precipitation towards improving forecasts of (extreme) precipitations in SE Asia. 1st Progress Meeting - Milano June 29, July 2 2009
CEOP – AEGIS Participants 1st Progress Meeting - Milano June 29, July 2 2009
Interrelation of project technical elements 1st Progress Meeting - Milano June 29, July 2 2009
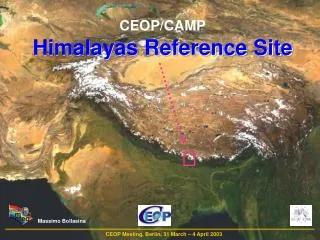
CA1: Ground based observations of fluxes Left: Nam Co site Right: Everest site 1st Progress Meeting - Milano June 29, July 2 2009
Eddy covariance, scintillometers and footprints Transmitter Footprint Flux tower Receiver Land use map Monthly variation of LAS flux contribution area (8:00am -17:00pm Jan – Dec, 2007) 1st Progress Meeting - Milano June 29, July 2 2009
Analysis of data quality of Tibetan energy balance measurements Namco site Data quality and its dependence on land use and footprint Metzger et al., Adv. Earth Sci. 21 (2006) 1260-1267 New Everest site 1st Progress Meeting - Milano June 29, July 2 2009
CA2: Optical observation of the land surface 1st Progress Meeting - Milano June 29, July 2 2009
Approach 1st Progress Meeting - Milano June 29, July 2 2009
CA3: Satellite based estimates of energy and water fluxes • LE scales with Tsurf IF radiative and convective forcing is normalized first • Additional constraints needed to solve SEB + parameterizations • Iterative procedures lead to multiple solutions • Inversion of detailed models abandoned many years ago new algorithms + easier access to computing power LUT-s may be worth a second life • Additional equations by segmenting images and assuming some parameters (e.g. ra) constant within the segment • Add experimental constraints by using limiting cases (reference system states) • Dry and wet reference states assumed to exist within image (SEBAL, S-SEBI) • Dry and wet reference states evaluated from theory (SEBI SEBS MSSEBS) 1st Progress Meeting - Milano June 29, July 2 2009
Limiting cases and additional constraints on SEB Evaporation controlled vs. radiation controlled T0=T0(r0) Empirical dry – wet references SEBAL, S-SEBI Tmax and Tmin from full combination equation SEBI, SEBS Reference Ta cannot be local: applies to an area much larger than the length-scale of land heterogeneity MS-SEBS 1st Progress Meeting - Milano June 29, July 2 2009
Web form MSSEBS 2 n-D NWPM fields Job spooler Image files Project file DEM XML parser Core GDAL Data repository Log file GEOSS provider MSSEBS 2 Framework Multiple SEB algorithms 1st Progress Meeting - Milano June 29, July 2 2009
CA4: Satellite based estimates of top soil moisture Different retrieval approaches • Empirical approaches • Semi-empirical approaches • Change detection methods • Theoretical scattering and emission models 1st Progress Meeting - Milano June 29, July 2 2009
METOP-A ASCAT Soil moisture results ASCAT data sigma zero triplet for values sigma zero triplet mid values Soil moisture (m3/m3 ) sigma zero triplet after values 1st Progress Meeting - Milano June 29, July 2 2009 14
CA5: Integrated ground and satellite observations of precipitations Refining data processing of ground based rain radars Improvement of interpolation method and 3D gridding Analysis of precipitation regimes over Tibetan Plateau and surrounding areas Evaluation of disdrometric measurements and algorithms to retrieve precipitation with VIS-IR data Development of algorithms for TIR data 1st Progress Meeting - Milano June 29, July 2 2009
4 radar data mosaic 1st Progress Meeting - Milano June 29, July 2 2009
CA6: Estimation of glaciers and snow meltwater Prototyping new algorithm for snow cover mapping Simulation of snow water equivalent based on SEB Collection and analysis of observations of reference glaciers Evaluation of SWE algorithms and data products 1st Progress Meeting - Milano June 29, July 2 2009
Calibrated radiance YES NDSI>=Threshold NO Cloud, water, snow in forest Snow, cloud, water Water mask YES Water YES Water mask Water Snow map NO Cloud products YES YES Cloud products Cloud Cloud NO NO DEM Snow Snow in forest Forest maps & NDVI Threshold YES Snow A snow cover extent prototype algorithm 1st Progress Meeting - Milano June 29, July 2 2009
CA7: Numerical Weather and Climate Modeling System Improving parameterization of subgrid processes Higher spatial resolution of GRAPES: 15 km Evaluation of sensitivity to soil initial conditions Case – studies on different land surface parameterizations Document relevant convective events over the Tibetan Plateau using TIR geostationary obs 1st Progress Meeting - Milano June 29, July 2 2009
Observation of convective events Blue: Averaged convective index, black circle: occurrence of MCS 1st Progress Meeting - Milano June 29, July 2 2009
CA8: Water Balance and Water Yield of the Tibetan Plateau 1st Progress Meeting - Milano June 29, July 2 2009
Selection of Water Balance Model 1st Progress Meeting - Milano June 29, July 2 2009
Long-term changes of meteorological factors (1966-2003) 1st Progress Meeting - Milano June 29, July 2 2009
CA9: Satellite Drought Monitoring System Algorithms developed to improve screening of MODIS data Algorithms to monitor drought using combined LST, VI, fAPAR Review of drought monitoring systems in China and India Document major drought events in China and India Analysis of AVHRR time series of LST and NDVI Ground and high resolution data for validation of low resolution drought indicators Improved Land Cover Land Use maps of several areas 1st Progress Meeting - Milano June 29, July 2 2009
-90 -75 -60 -45 -30 -15 0 15 30 45 60 75 90º LST vs NDVI correlation IHS of LST vs. NDVI correlation Colors indicate θ values; Intensity codes d values, characterizing NDVI-LST annual cycle; Saturation codes R2 values; 1st Progress Meeting - Milano June 29, July 2 2009
Drought monitoring and Early Warning by detecting anomalies Anomaly: Deviation of current state from historical average Sichuan-Chongqing drought, 2006 1st Progress Meeting - Milano June 29, July 2 2009
Drought monitoring and Early Warning by detecting anomalies EVI anomaly LST anomaly Tibet Plateau and Sichuan-Chongqing, 2006 9 May 10 June 12 July 13 Aug 1st Progress Meeting - Milano June 29, July 2 2009
CA10: Satellite Flood Monitoring System of Pilot Areas Document flood drought prone areas in China and India Review flood forecast in India Development of flood hazard evaluation system 1st Progress Meeting - Milano June 29, July 2 2009
India • Flow Data is being collected from Government of Bihar for Bgmti river basin. • Flow Data of key stations of Main Ganga river and Brahmputra river would be collected from shortly. • Precipitation data is being procured from Meteorological Department on payment basis for flood and drought studies (both). • All the map are being digitized in ArcGIS, which would be input to the model. • IRS-LISS II and PAN data is being procured and landuse map is being prepared using ERDAS 9.3 (latest version). • ANN model is being tested for some of the flood events. 1st Progress Meeting - Milano June 29, July 2 2009
Hydrologic data Remote Sensing image DEM Remote Sensing image Socio-Economic data Hydro-dynamic model (HEC-RAS) Population Land use Floodarea Flood depth Economic Value map Population density map Flood frequency Assessment method Hazard factors data Vulnerability factors data Flood risk assessment and impact evaluation model Finished Flood impact analysis Flood risk analysis Partly-Finished Unfinished Flood risk and impact maps China 1st Progress Meeting - Milano June 29, July 2 2009
Thank you! 1st Progress Meeting - Milano June 29, July 2 2009