Download
1 / 13
130 likes | 777 Vues
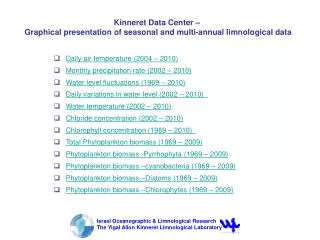
Israel Oceanographic & Limnological Research The Yigal Allon Kinneret Limnological Laboratory. Kinneret Data Center – Graphical presentation of seasonal and multi-annual limnological data. Daily air temperature (2004 – 2010) Monthly precipitation rate (2002 – 2010)

E N D
Israel Oceanographic & Limnological Research The Yigal Allon Kinneret Limnological Laboratory Kinneret Data Center – Graphical presentation of seasonal and multi-annual limnological data • Daily air temperature (2004 – 2010) • Monthly precipitation rate (2002 – 2010) • Water level fluctuations (1969 – 2010) • Daily variations in water level (2002 – 2010) • Water temperature (2002 – 2010) • Chloride concentration (2002 – 2010) • Chlorophyll concentration (1989 – 2010) • Total Phytoplankton biomass (1969 – 2009) • Phytoplankton biomass -Pyrrhophyta (1969 – 2009) • Phytoplankton biomass –cyanobacteria (1969 – 2009) • Phytoplankton biomass –Diatoms (1969 – 2009) • Phytoplankton biomass –Chlorophytes (1969 – 2009)
Israel Oceanographic & Limnological Research The Yigal Allon Kinneret Limnological Laboratory Back to main Screen Air temperature 2005 – 2010 Red dots – Daily maximal values, Blue dotes – Daily minimal values. (Values are hourly averages)
Israel Oceanographic & Limnological Research The Yigal Allon Kinneret Limnological Laboratory Back to main Screen Monthly precipitation rate 2002 - 2010 Average value for 4 meteorological stations (Tzemah, Bteha, Station A and Tabha)
Israel Oceanographic & Limnological Research The Yigal Allon Kinneret Limnological Laboratory Back to main Screen Water level in Lake Kinneret (1969 – 2010) Horizontal red lines present Upper (-208.80 m ASL) and lower (-213.00 m ASL) operational levels Data source: Hydrological service, Israel Water Commission)
Israel Oceanographic & Limnological Research The Yigal Allon Kinneret Limnological Laboratory Back to main Screen Daily changes in water level (2004 – 2010) Horizontal red lines present Upper (-208.80 m ASL) and lower (-213.00 m ASL) operational levels Data source: Hydrological service, Israel Water Commission)
Israel Oceanographic & Limnological Research The Yigal Allon Kinneret Limnological Laboratory Back to main Screen Water temperature in Lake Kinneret (1996 – 2010) Data present monthly average values for the upper water column (5 m)
Israel Oceanographic & Limnological Research The Yigal Allon Kinneret Limnological Laboratory Back to main Screen Concentration of chloride in Lake Kinneret (1969 – 2010) Data present monthly average values for the upper water column (5 m)
Israel Oceanographic & Limnological Research The Yigal Allon Kinneret Limnological Laboratory Back to main Screen Chlorophyll concentration (1989 – 2010) Data present monthly average values for the upper water column (5 m)
Israel Oceanographic & Limnological Research The Yigal Allon Kinneret Limnological Laboratory Back to main Screen Areal Concentration of phytoplankton biomass (1969 – 2009) Data present monthly average values
Israel Oceanographic & Limnological Research The Yigal Allon Kinneret Limnological Laboratory Back to main Screen Areal Concentration of Pyrrhophyta biomass (1969 – 2009) Data present monthly average values
Israel Oceanographic & Limnological Research The Yigal Allon Kinneret Limnological Laboratory Back to main Screen Areal Concentration of Cyanobacteria biomass (1969 – 2009) Data present monthly average values
Israel Oceanographic & Limnological Research The Yigal Allon Kinneret Limnological Laboratory Back to main Screen Areal Concentration of Diatom biomass (1969 – 2009) Data present monthly average values
Israel Oceanographic & Limnological Research The Yigal Allon Kinneret Limnological Laboratory Back to main Screen Areal Concentration of Chlorophyta biomass (1969 – 2009) Data present monthly average values