Download
1 / 9
90 likes | 115 Vues
MRFR team have supreme objective to provide the optimum quality market research and intelligence services to our clients. Our market research studies by products, services, technologies, applications, end users, and market players for global, regional, and country level market segments, enable our clients to see more, know more, and do more, which help to answer all their most important questions.

E N D
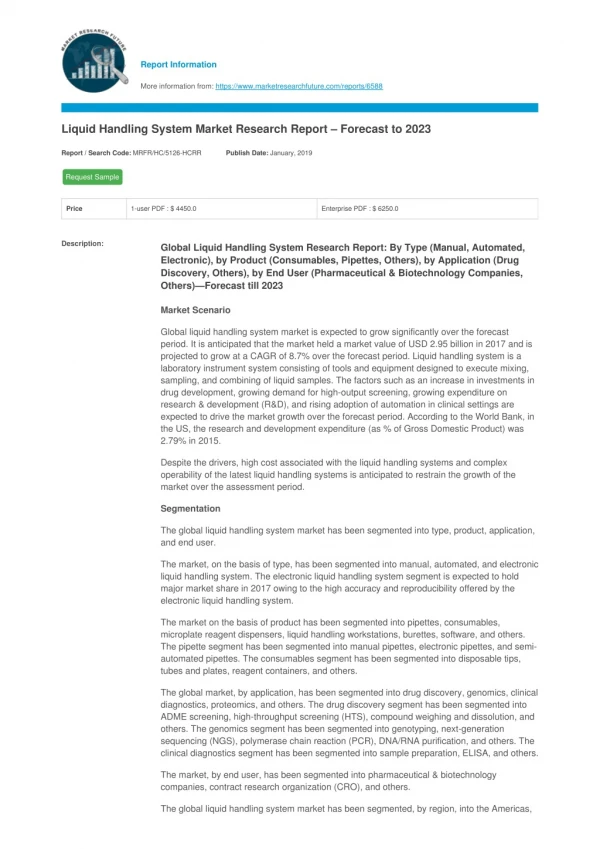
Report Information More information from: https://www.marketresearchfuture.com/reports/6588 Liquid Handling System Market Research Report – Forecast to 2023 Report / Search Code: MRFR/HC/5126-HCRR Publish Date: January, 2019 Request Sample Price 1-user PDF : $ 4450.0 Enterprise PDF : $ 6250.0 Description: Global Liquid Handling System Research Report: By Type (Manual, Automated, Electronic), by Product (Consumables, Pipettes, Others), by Application (Drug Discovery, Others), by End User (Pharmaceutical & Biotechnology Companies, Others)—Forecast till 2023 Market Scenario Global liquid handling system market is expected to grow significantly over the forecast period. It is anticipated that the market held a market value of USD 2.95 billion in 2017 and is projected to grow at a CAGR of 8.7% over the forecast period. Liquid handling system is a laboratory instrument system consisting of tools and equipment designed to execute mixing, sampling, and combining of liquid samples. The factors such as an increase in investments in drug development, growing demand for high-output screening, growing expenditure on research & development (R&D), and rising adoption of automation in clinical settings are expected to drive the market growth over the forecast period. According to the World Bank, in the US, the research and development expenditure (as % of Gross Domestic Product) was 2.79% in 2015. Despite the drivers, high cost associated with the liquid handling systems and complex operability of the latest liquid handling systems is anticipated to restrain the growth of the market over the assessment period. Segmentation The global liquid handling system market has been segmented into type, product, application, and end user. The market, on the basis of type, has been segmented into manual, automated, and electronic liquid handling system. The electronic liquid handling system segment is expected to hold major market share in 2017 owing to the high accuracy and reproducibility offered by the electronic liquid handling system. The market on the basis of product has been segmented into pipettes, consumables, microplate reagent dispensers, liquid handling workstations, burettes, software, and others. The pipette segment has been segmented into manual pipettes, electronic pipettes, and semi- automated pipettes. The consumables segment has been segmented into disposable tips, tubes and plates, reagent containers, and others. The global market, by application, has been segmented into drug discovery, genomics, clinical diagnostics, proteomics, and others. The drug discovery segment has been segmented into ADME screening, high-throughput screening (HTS), compound weighing and dissolution, and others. The genomics segment has been segmented into genotyping, next-generation sequencing (NGS), polymerase chain reaction (PCR), DNA/RNA purification, and others. The clinical diagnostics segment has been segmented into sample preparation, ELISA, and others. The market, by end user, has been segmented into pharmaceutical & biotechnology companies, contract research organization (CRO), and others. The global liquid handling system market has been segmented, by region, into the Americas,
Europe, Asia-Pacific, and the Middle East & Africa. The liquid handling system market in the Americas has further been segmented into North America and South America, with the North American market divided into the US and Canada. The European liquid handling system market has been segmented into Western Europe and Eastern Europe. Western Europe has further been segmented as Germany, France, the UK, Italy, Spain, and the rest of Western Europe. The liquid handling system market in Asia-Pacific has been segmented into Japan, China, India, South Korea, Australia, and the rest of Asia-Pacific. The liquid handling system market in the Middle East & Africa has been segmented into the Middle East and Africa. Key players Agilent Technologies, Danaher Corporation, Thermo Fisher Scientific, Inc., Eppendorf AG, Tecan Group Ltd., Bio-Rad Laboratories, Corning Incorporated, Sartorius AG, Hamilton Company, Mettler-Toledo International Inc., and Perkinelmer, Inc. are some of the key players in the global liquid handling system market. Regional Market Summary Global Liquid Handling System Market Share (%), by Region, 2017 Source: Centers for Disease Control and Prevention (CDC), Office for National Statistics, White Papers, Company Presentations Geographically, the Americas is anticipated to dominate the global liquid handling system market owing to a well-developed healthcare sector, the high adoption rate of advanced technologies, and growing expenditure for healthcare. According to the Centers for Disease Control and Prevention (CDC), the total national health expenditures were USD 3.2 trillion in 2015. Europe is expected to hold the second largest position in the global liquid handling system market. The market growth in this region is attributed to the growing R&D activities and growing biopharmaceutical sector. According to the Office for National Statistics, gross domestic expenditure on R&D was Euro 33.1 billion (USD 35.2 billion) in the year 2016. The liquid handling system market in Asia-Pacific region consists of countries namely China, Japan, Republic of Korea, India, Australia and Rest of Asia-Pacific. The Asia-Pacific region is expected to be the fastest growing region owing to the improving scenario of life science related research, developing healthcare sector, and growing government investments in biotechnology and pharmaceutical sector. The Middle East & Africa has the least share of the global liquid handling system market. Majority of the market of this region is expected to be held by the Middle East region due to the growing government initiatives for the healthcare segment which thereby provides a favorable scenario for the growth of pharmaceutical and biotechnological sector in the region.
Global Liquid Handling System Market, by Type Manual Automated Electronic Global Liquid Handling System Market, by Product Pipettes Manual Pipettes Electronic Pipettes Semi-Automated Pipettes Consumables Disposable Tips Tubes and Plates Reagent Containers Others Microplate Reagent Dispenser Liquid Handling Workstations Burettes Software Others Global Liquid Handling System Market, by Application Drug Discovery ADME Screening High-Throughput Screening (HTS) Compound Weighing and Dissolution Others Genomics Genotyping Next-Generation Sequencing (NGS) Polymerase Chain reaction (PCR) DNA/RNA Purification Others Clinical Diagnostics Sample Preparation ELISA
Others Proteomics Others Global Liquid Handling System Market, by End User Pharmaceutical & Biotechnology Companies Contract Research Organization (CRO) Others Global Liquid Handling System Market, by Region Americas North America US Canada South America Europe Western Europe Germany France Italy Spain UK Rest of Western Europe Eastern Europe Asia-Pacific Japan China India Australia South Korea Rest of Asia-Pacific
The Middle East & Africa Middle East Africa Intended Audience Manufacturers and vendors of NPWT devices Research associations related to NPWT Various research and consulting firms Distributors of NPWT devices Contents: Contents Table of Contents: Chapter 1. Report Prologue Chapter 2. Market Introduction 2.1 Definition 2.2 Scope of the Study 2.2.1 Research Objective 2.2.2 Assumptions 2.2.3 Limitations Chapter 3. Research Methodology 3.1 Introduction 3.2 Primary Research 3.3 Secondary Research 3.4 Market Size Estimation Chapter 4. Market Dynamics 4.1 Drivers 4.2 Restraints 4.3 Opportunities 4.4 Challenges 4.5 Macroeconomic Indicators 4.6 Technology Trends & Assessment Chapter 5. Market Factor Analysis 5.1 Porter’s Five Forces Analysis 5.1.1 Bargaining Power of Suppliers 5.1.2 Bargaining Power of Buyers 5.1.3 Threat of New Entrants 5.1.4 Threat of Substitutes 5.1.5 Intensity of Rivalry 5.2 Value Chain Analysis 5.3 Investment Feasibility Analysis 5.4 Pricing Analysis Chapter 6. Global Liquid Handling System Market, by Type 6.1 Introduction 6.2 Manual Liquid Handling System Market Estimates & Forecast, by Region, 2018–2023 Market Estimates & Forecast, by Country, 2018–2023 6.3 Automated Liquid Handling System Market Estimates & Forecast, by Region, 2018–2023 Market Estimates & Forecast, by Country, 2018–2023 6.4 Electronic Liquid Handling System Market Estimates & Forecast, by Region, 2018–2023 Market Estimates & Forecast, by Country, 2018–2023 Chapter 7. Global Liquid Handling System Market, by Product 7.1 Introduction 7.2 Pipettes 7.2.1 Manual Pipettes Market Estimates & Forecast, by Region, 2018–2023 Market Estimates & Forecast, by Country, 2018–2023 7.2.2 Electronic Pipettes Market Estimates & Forecast, by Region, 2018–2023 Market Estimates & Forecast, by Country, 2018–2023 7.2.3 Semi-Automated Pipettes Market Estimates & Forecast, by Region, 2018–2023 Market Estimates & Forecast, by Country, 2018–2023 7.3 Consumables 7.3.1 Disposable Tips Market Estimates & Forecast, by Region, 2018–2023
Market Estimates & Forecast, by Country, 2018–2023 7.3.2 Tubes and Plates Market Estimates & Forecast, by Region, 2018–2023 Market Estimates & Forecast, by Country, 2018–2023 7.3.3 Reagent Containers Market Estimates & Forecast, by Region, 2018–2023 Market Estimates & Forecast, by Country, 2018–2023 7.3.4 Others 7.4 Microplate Reagent Dispensers Market Estimates & Forecast, by Region, 2018–2023 Market Estimates & Forecast, by Country, 2018–2023 7.5 Liquid Handling Workstations Market Estimates & Forecast, by Region, 2018–2023 Market Estimates & Forecast, by Country, 2018–2023 7.6 Burettes Market Estimates & Forecast, by Region, 2018–2023 Market Estimates & Forecast, by Country, 2018–2023 7.7 Software Market Estimates & Forecast, by Region, 2018–2023 Market Estimates & Forecast, by Country, 2018–2023 7.8 Others Chapter 8. Global Liquid Handling System Market, by Application 8.1 Introduction 8.2 Drug Discovery 8.2.1 ADME Screening Market Estimates & Forecast, by Region, 2018–2023 Market Estimates & Forecast, by Country, 2018–2023 8.2.2 High-Throughput Screening (HTS) Market Estimates & Forecast, by Region, 2018–2023 Market Estimates & Forecast, by Country, 2018–2023 8.2.3 Compound Weighing and Dissolution Market Estimates & Forecast, by Region, 2018–2023 Market Estimates & Forecast, by Country, 2018–2023 8.2.4 Others 8.3 Genomics 8.3.1 Genotyping Market Estimates & Forecast, by Region, 2018–2023 Market Estimates & Forecast, by Country, 2018–2023 8.3.2 Next-Generation Sequencing (NGS) Market Estimates & Forecast, by Region, 2018–2023 Market Estimates & Forecast, by Country, 2018–2023 8.3.3 Polymerase Chain Reaction (PCR) Market Estimates & Forecast, by Region, 2018–2023 Market Estimates & Forecast, by Country, 2018–2023 8.3.4 DNA/RNA Purification Market Estimates & Forecast, by Region, 2018–2023 Market Estimates & Forecast, by Country, 2018–2023 8.3.4 Others 8.4 Clinical Diagnostics 8.4.1 Sample Preparation Market Estimates & Forecast, by Region, 2018–2023 Market Estimates & Forecast, by Country, 2018–2023 8.4.2 ELISA Market Estimates & Forecast, by Region, 2018–2023 Market Estimates & Forecast, by Country, 2018–2023 8.4.2 Others 8.5 Proteomics Market Estimates & Forecast, by Region, 2018–2023 Market Estimates & Forecast, by Country, 2018–2023 8.6 Others Chapter 9. Global Liquid Handling System Market, by End User 9.1 Introduction 9.2 Pharmaceutical & Biotechnology Companies Market Estimates & Forecast, by Region, 2018–2023 Market Estimates & Forecast, by Country, 2018–2023 9.3 Contract Research Organization (CRO) Market Estimates & Forecast, by Region, 2018–2023 Market Estimates & Forecast, by Country, 2018–2023 9.4 Other Market Estimates & Forecast, by Region, 2018–2023 Market Estimates & Forecast, by Country, 2018–2023 Chapter 10. Global Liquid Handling System Market, by Region 10.1 Introduction 10.2 Americas 10.2.1 North America 10.2.1.1 US 10.2.1.2 Canada 10.2.2 South America 10.3 Europe 10.3.1 Western Europe 10.3.1.1 Germany
10.3.1.2 France 10.3.1.3 Italy 10.3.1.4 Spain 10.3.1.5 UK 10.3.1.6 Rest of Western Europe 10.3.2 Eastern Europe 10.4 Asia-Pacific 10.4.1 Japan 10.4.2 China 10.4.3 India 10.4.4 Australia 10.4.5 South Korea 10.4.6 Rest of Asia-Pacific 10.5 Middle East & Africa 10.5.1 Middle East 10.5.2 Africa Chapter 11. Company Landscape 11.1 Introduction 11.2 Market Share Analysis 11.3 Key Development & Strategies Chapter 12. Company Profiles 12.1 Agilent Technologies 12.1.1 Company Overview 12.1.2 Product Overview 12.1.3 Financials Overview 12.1.4 Key Developments 12.1.5 SWOT Analysis 12.2 Danaher Corporation 12.2.1 Company Overview 12.2.2 Product Overview 12.2.3 Financial Overview 12.2.4 Key Developments 12.2.5 SWOT Analysis 12.3 Thermo Fisher Scientific Inc. 12.3.1 Company Overview 12.3.2 Product Overview 12.3.3 Financial Overview 12.3.4 Key Development 12.3.5 SWOT Analysis 12.4 Eppendorf AG 12.4.1 Company Overview 12.4.2 Product Overview 12.4.3 Financial Overview 12.4.4 Key Development 12.4.5 SWOT Analysis 12.5 Tecan Group Ltd. 12.5.1 Company Overview 12.5.2 Product Overview 12.5.3 Financial overview 12.5.4 Key Developments 12.5.5 SWOT Analysis 12.6 Bio-Rad Laboratories 12.6.1 Company Overview 12.6.2 Product Overview 12.6.3 Financial Overview 12.6.4 Key Developments 12.6.5 SWOT Analysis 12.7 Corning Incorporated 12.7.1 Overview 12.7.2 Product Overview 12.7.3 Financial Overview 12.7.4 Key Developments 12.7.5 SWOT Analysis 12.8 Sartorius AG 12.8.1 Overview 12.8.2 Product Overview 12.8.3 Financials 12.8.4 Key Developments 12.8.5 SWOT Analysis 12.9 Hamilton Company 12.9.1 Overview 12.9.2 Product Overview 12.9.3 Financials 12.9.4 Key Developments 12.9.5 SWOT Analysis 12.10 Mettler-Toledo International Inc. 12.10.1 Overview 12.10.2 Product Overview 12.10.3 Financials 12.10.4 Key Developments 12.10.5 SWOT Analysis
12.11 PerkinElmer, Inc. 12.11.1 Overview 12.11.2 Product Overview 12.11.3 Financials 12.11.4 Key Developments 12.11.5 SWOT Analysis 12.12 Others Chapter 13 MRFR Conclusion 13.1 Key Findings 13.1.1 From CEO’s Viewpoint 13.1.2 Unmet Needs of the Market 13.2 Key Companies to Watch 13.3 Predictions for the Global Liquid Handling System Industry Chapter 14. Appendix LIST OF TABLES Table 1 Global Liquid Handling System Market Synopsis, 2018–2023 Table 2 Global Liquid Handling System Market Estimates and Forecast, 2018–2023 (USD Million) Table 3 Global Liquid Handling System Market, by Region, 2018–2023 (USD Million) Table 4 Global Liquid Handling System Market, by Type, 2018–2023 (USD Million) Table 5 Global Liquid Handling System Market, by Product, 2018–2023 (USD Million) Table 6 Global Liquid Handling System Market, by Application, 2018–2023 (USD Million) Table 7 Global Liquid Handling System Market, by End User, 2018–2023 (USD Million) Table 8 North America: Liquid Handling System Market, by Type, 2018–2023 (USD Million) Table 9 North America: Liquid Handling System Market, by Product, 2018–2023 (USD Million) Table 10 North America: Liquid Handling System Market, by Application, 2018–2023 (USD Million) Table 11 North America: Liquid Handling System Market, by End User, 2018–2023 (USD Million) Table 12 US: Liquid Handling System Market, by Type, 2018–2023 (USD Million) Table 13 US: Liquid Handling System Market, by Product, 2018–2023 (USD Million) Table 14 US: Liquid Handling System Market, by Application, 2018–2023 (USD Million) Table 15 US: Liquid Handling System Market, by End User, 2018–2023 (USD Million) Table 16 Canada: Liquid Handling System Market, by Type, 2018–2023 (USD Million) Table 17 Canada: Liquid Handling System Market, by Product, 2018–2023 (USD Million) Table 18 Canada: Liquid Handling System Market, by Application, 2018–2023 (USD Million) Table 19 Canada: Liquid Handling System Market, by End User, 2018–2023 (USD Million) Table 20 South America: Liquid Handling System Market, by Type, 2018–2023 (USD Million) Table 21 South America: Liquid Handling System Market, by Product, 2018–2023 (USD Million) Table 22 South America: Liquid Handling System Market, by Application, 2018–2023 (USD Million) Table 23 South America: Liquid Handling System Market, by End User, 2018–2023 (USD Million) Table 24 Europe: Liquid Handling System Market, by Type, 2018–2023 (USD Million) Table 25 Europe: Liquid Handling System Market, by Product, 2018–2023 (USD Million) Table 26 Europe: Liquid Handling System Market, by Application, 2018–2023 (USD Million) Table 27 Europe: Liquid Handling System Market, by End User, 2018–2023 (USD Million) Table 28 Western Europe: Liquid Handling System Market, by Type, 2018–2023 (USD Million) Table 29 Western Europe: Liquid Handling System Market, by Product, 2018–2023 (USD Million) Table 30 Western Europe: Liquid Handling System Market, by End User, 2018–2023 (USD Million) Table 31 Eastern Europe: Liquid Handling System Market, by Type, 2018–2023 (USD Million) Table 32 Eastern Europe: Liquid Handling System Market, by Product, 2018–2023 (USD Million) Table 33 Eastern Europe: Liquid Handling System Market, by Application, 2018–2023 (USD Million) Table 34 Eastern Europe: Liquid Handling System Market, by End User, 2018–2023 (USD Million) Table 35 Asia-Pacific: Liquid Handling System Market, by Type, 2018–2023 (USD Million) Table 36 Asia-Pacific: Liquid Handling System Market, by Product, 2018–2023 (USD Million) Table 37 Asia-Pacific: Liquid Handling System Market, by Application, 2018–2023 (USD Million) Table 38 Asia-Pacific: Liquid Handling System Market, by End User, 2018–2023 (USD Million) Table 39 Middle East & Africa: Liquid Handling System Market, by Type, 2018–2023 (USD Million) Table 40 Middle East & Africa: Liquid Handling System Market, by Product, 2018–
2023 (USD Million) Table 41 Middle East & Africa: Liquid Handling System Market, by Application, 2018– 2023 (USD Million) Table 42 Middle East & Africa: Liquid Handling System Market, by End User, 2018– 2023 (USD Million) LIST OF FIGURES Figure 1 Research Process Figure 2 Segmentation for Global Liquid Handling System Market Figure 3 Segmentation Market Dynamics for Global Liquid Handling System Market Figure 4 Global Liquid Handling System Market Share, by Type, 2017 Figure 5 Global Liquid Handling System Market Share, by Application, 2017 Figure 6 Global Liquid Handling System Market Share, by Product, 2017 Figure 7 Global Liquid Handling System Market Share, by End User, 2017 Figure 8 Global Liquid Handling System Market Share, by Region, 2017 Figure 9 North America: Liquid Handling System Market Share, by Country, 2017 Figure 10 Europe: Liquid Handling System Market Share, by Country, 2017 Figure 11 Asia-Pacific: Liquid Handling System Market Share, by Country, 2017 Figure 12 Middle East & Africa: Liquid Handling System Market Share, by Country, 201 Figure 13 Global Liquid Handling System Market: Company Share Analysis, 2017 (%) Figure 14 Agilent Technologies: Key Financials Figure 15 Agilent Technologies: Segmental Revenue Figure 16 Agilent Technologies: Geographical Revenue Figure 17 Danaher Corporation: Key Financials Figure 18 Danaher Corporation: Segmental Revenue Figure 19 Danaher Corporation: Geographical Revenue Figure 20 Thermo Fisher Scientific Inc.: Key Financials Figure 21 Thermo Fisher Scientific Inc.: Segmental Revenue Figure 22 Thermo Fisher Scientific Inc.: Geographical Revenue Figure 23 Eppendorf AG: Key Financials Figure 24 Eppendorf AG: Segmental Revenue Figure 25 Eppendorf AG: Geographical Revenue Figure 26 Tecan Group Ltd.: Key Financials Figure 27 Tecan Group Ltd.: Segmental Revenue Figure 28 Tecan Group Ltd.: Geographical Revenue Figure 29 Bio-Rad Laboratories: Key Financials Figure 30 Bio-Rad Laboratories: Segmental Revenue Figure 31 Bio-Rad Laboratories: Geographical Revenue Figure 32 Corning Incorporated: Key Financials Figure 34 Corning Incorporated: Segmental Revenue Figure 35 Corning Incorporated: Geographical Revenue Figure 36 Sartorius AG: Key Financials Figure 37 Sartorius AG: Segmental Revenue Figure 38 Sartorius AG: Geographical Revenue Figure 39 Hamilton Company: Key Financials Figure 40 Hamilton Company: Segmental Revenue Figure 41 Hamilton Company: Geographical Revenue Figure 42 Mettler-Toledo International Inc.: Key Financials Figure 43 Mettler-Toledo International Inc.: Segmental Revenue Figure 44 Mettler-Toledo International Inc.: Geographical Revenue Figure 45 PerkinElmer, Inc.: Key Financials Figure 46 PerkinElmer, Inc.: Segmental Revenue Figure 47 PerkinElmer, Inc.: Geographical Revenue marketresearchfuture.com / Phone (US) + 1-646-845-9349 (UK) +44 208 133 9349