Download
1 / 50
520 likes | 898 Vues
Constraining Dark Energy with the Supernova Legacy Survey. Mark Sullivan University of Toronto http://legacy.astro.utoronto.ca/ http://cfht.hawaii.edu/SNLS/. Paris Group Reynald Pain, Pierre Astier, Julien Guy, Nicolas Regnault, Christophe Balland, Delphine Hardin, Jim Rich, + ….

E N D
Constraining Dark Energy with the Supernova Legacy Survey Mark Sullivan University of Toronto http://legacy.astro.utoronto.ca/ http://cfht.hawaii.edu/SNLS/
Paris Group Reynald Pain, Pierre Astier, Julien Guy, Nicolas Regnault, Christophe Balland, Delphine Hardin, Jim Rich, + … Toronto Group Ray Carlberg, Alex Conley, Andy Howell, Kathy Perrett, Mark Sullivan Victoria Group Chris Pritchet, Dave Balam, + … Marseille Group Stephane Basa, Dominique Fouchez, + … UK Gemini PI: Isobel Hook, Richard McMahon, + … USA LBL: Saul Perlmutter, + … CIT: Don Neill The SNLS collaboration Full list of collaborators at: http://cfht.hawaii.edu/SNLS/
White Dwarf SNe Ia are thermonuclear explosions of C-O white dwarf stars “Standard” nuclear physics Bright: 10 billion suns Standardizable: 7% calibration Brightness and homogeneity make them the best measure of distance, and hence dark energy, in the Universe
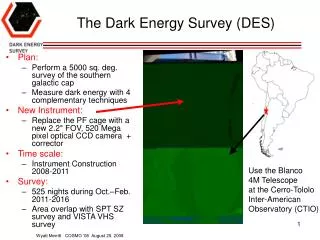
Supernova Legacy Survey (2003-2008) • 5 year survey, goal: 500 distant SNe Ia to measure “w” • Uses CFHT/“Megacam” • 36 CCDs, good blue response • 4 filters for good k-corrections and color measurement Megaprime
CFHT-LS Organisation • SNLScollaboration • Data-processing • Major Spectroscopic Program • Gemini (Canada/UK/USA) • 120 hrs/yr (60:40:20) • VLT (France/Other Euros) • 120 hrs/yr • Keck (through LBL) • 40 hrs/yr • Cosmological analyses • Magellan near-IR study (Freedman et al.) • Rest-frame I-band Hubble diagram • Keck SN Ia UV study (Ellis/Sullivan et al.) • LRIS high-S/N - metallicity through UV lines • Testing accuracy of k-corrections in the UV • SN IIP study (Nugent/Sullivan/Ellis et al.) • Using SNe IIP as standard candles • Independent Hubble diagram to z=0.5
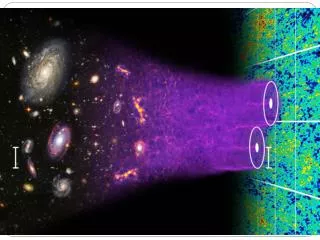
Supernova Legacy Survey Imaging Distances from light-curves Spectroscopy Redshifts Distances from cosmological model Discoveries Lightcurves Gemini N & S (120 hr/yr) VLT (120 hr/yr) g’r’i’z’ every 4 days during dark time Magellan (15 nights/yr) Keck (8 nights/yr)
Making a standard candle 1. “Phillipsrelation”: A correction to SN Ia light-curves based on light-curve shape drastically improves the quality of the standard candle. Brightness 56Ni 56Co 56Fe powers the SN Ia light-curve • Conventional Wisdom: • SNe are a one-parameter family defined by amount of 56Ni synthesized in the explosion. • More 56Ni greater luminosity higher Temperatures higher opacity broader LC Time Brightness Time
Making a standard candle 1. “Phillipsrelation”: A correction to SN Ia light-curves based on light-curve shape drastically improves the quality of the standard candle. 2. SN colour: A correction to the SN luminosity based on the SN colour Fainter Blue Red Colour at peak
Making a standard candle 1. “Phillipsrelation”: A correction to SN Ia light-curves based on light-curve shape drastically improves the quality of the standard candle. 20% Brightness 2. SN colour: A correction to the SN luminosity based on the SN colour • Many methods: • Stretch – Perlmutter 97, 99 • (M)LCS(2k2) – Riess, 95,96, Jha 07 • SALT(2) – Guy 05, 07 • SiFTO – Sullivan 07 • CMAGIC – Wang et al.; Conley 06 • Δm15 – Phillips 93; Hamuy 95; Prieto 06 Brightness 7%! Time
“Local” SN Ia Hubble Diagrams Most light-curve fitting techniques fare equally well Prieto et al. 2006 Jha et al. 2007
Light-curve fit parameters from different fitters are tightly correlated
A Typical SNWhat we need to measure Peak brightness Colour (c) Lightcurve width (stretch)
SNLS: Current status • Survey running for 3.5 years • ~310 confirmed distant SNe Ia (+ 40-50 not yet processed) • ~ Largest single telescope sample of SNe • “On track” for 500 spectroscopically confirmed SNe Ia by survey end (>1000/>2000 total SNIa/All SN light-curves)
First-Year SNLS Hubble Diagram SNLS 1st year Astier et al. 2006 349 citations (187 in refereed journals) ΩM = 0.263 ± 0.042 (stat) ± 0.032 (sys) <w>=-1.02 ± 0.09 (stat) ± 0.054 (sys)
“Third year” SNLS Hubble Diagram (preliminary) 3/5 years of SNLS ~240 distant SNe Ia • Independent analysis to 1st year: • Different calibration route • Different photometric methods • Different SN light-curve analysis tools Preliminary Sullivan et al. 2007
“Third year” SNLS Hubble Diagram (preliminary) Best-fit for SNLS+flatness Preliminary (error was 0.042 in A06) ΩM=0.3, Ωλ=0 ΩM=1.0, Ωλ=0 Sullivan et al. 2007
Cosmological Constraints (Preliminary) SNe WMAP-3 6-7% measure of <w> SNe BAO BAO SNLS+BAO (No flatness) SNLS + BAO + simple WMAP + Flat Sullivan et al. 2007
Future Prospects with SNLS • Current constraints on <w>: <w>=-1 to ~6-7% (stat) • <w> >-0.8 excluded at 3-sigma level • At survey end a 4-5% statistical measure will be achieved: • 500 SNLS + 200(?) SDSS + new local samples • Improved external constraints (BAO, WMAP, WL) • Systematic errors becoming ever more important
Potential SN Systematics in measuring w(a) More “mundane” • “Experimental Systematics” • Calibration, photometry, Malmquist-type effects • Contamination by non-SNe Ia • Minimized by spectroscopic confirmation • K-corrections • UV uncertain; “golden” redshifts; spectral evolution? • Non-SNe systematics • Peculiar velocities; Hubble Bubble; Weak lensing • Extinction • Effective RB;Dust evolution • Redshift evolution in the mix of SNe • “Population drift” – environment? • Evolution in SN properties • Light-curves/Colors/Luminosities More “scientifically interesting”
Hubble Bubble • Latest MLCS2k2 paper (Jha 2007) • MLCS2k2 attempts to separate intrinsic colour-luminosity and reddening • 3σ decrease in Hubble constant at ≈7400 km/sec – local value of H0 high; distant SNe too faint • Local void in mass density? • Could have significant effects on w measurement SALT MLCS2k2 No Bubble with other light-curve fitters! Conley et al. (2007)
Light-curve fit parameters from different fitters are tightly correlated
Handling colour in SN Ia • Colour is the most important correction to SN Ia luminosities • Underlying physics: Redder SNe Ia are fainter due to • Extinction along the line of sight • Intrinsic luminosity/colour relationship of the SN population • Two basic approaches: • Attempt to identify intrinsic relationship and assume standard dust dominates the rest (Jha et al.) • Fit a luminosity/colour relationship empirically on the SN data β=4.1
Observed: β ~ 2 Standard Dust: β ~ 4.1 “Bubble” significance versus “β” Conley et al. (2007)
All fitters agree: β<4.1 Conley et al. (2007)
What does β=2 (RV=1) mean? • Very strange dust? But RV=1 is not seen anywhere in the Milky Way • Dust around SNe is changed by the explosion? • Most likely: SNe have an (as yet) uncorrected-for intrinsic colour-luminosity relationship • While fitting empirically for β may be empirical, currently it’s the best way
Potential SN Systematics in measuring w(a) More “mundane” • “Experimental Systematics” • Calibration, photometry, Malmquist-type effects • Contamination by non-SNe Ia • Minimized by spectroscopic confirmation • K-corrections • UV uncertain; “golden” redshifts; spectral evolution? • Non-SNe systematics • Peculiar velocities; Hubble Bubble; Weak lensing • Extinction • Effective RB;Dust evolution • Redshift evolution in the mix of SNe • “Population drift” – environment? • Evolution in SN properties • Light-curves/Colors/Luminosities More “scientifically interesting”
More “mundane” More “scientifically interesting” Potential SN Systematics in measuring w(a) • “Experimental Systematics” • Calibration, photometry, Malmquist-type effects • Contamination by non-SNe Ia • Minimized by spectroscopic confirmation • K-corrections • UV uncertain; “golden” redshifts; spectral evolution? • Non-SNe systematics • Peculiar velocities; Hubble Bubble; Weak lensing • Extinction • Effective RB;Dust evolution • Redshift evolution in the mix of SNe • “Population drift” – environment? • Evolution in SN properties • Light-curves/Colors/Luminosities “Population Evolution”
White Dwarf • Many uncertainties: • Nature of progenitor system – the “second star” • Single versus double degenerate? • Young versus old progenitor? • Explosion mechanism? • Effect of progenitor metallicity on luminosity? ?
Host galaxies impact SN properties SN Ia Light-curve shape depends on morphology e.g. Hamuy et al. (2000) High stretch Low stretch Some evidence that SNe Ia in ellipticals show smaller scatter Sullivan et al. (2003)
r i z g u Typing of SNLS SN Ia hosts • Little morphological information available • CFHT u*g’r’i’z’ imaging via the Legacy program. • PEGASE2 is used to fit SED templates to the optical data. • Recent star-formation rate, total stellar mass, mean age are estimated. • Hosts classified according to physical parameters instead of “what they look like”. Passive Star-forming Starbursting Sullivan et al. (2006)
SNLS: SN rate as a function of sSFR SN Ia hosts classified by star-formation activity Per unit stellar mass, SNe are at least an order of magnitude more common in more vigorously star-forming galaxies SNLS “passive” galaxies
SNLS selection of hosts D2 ACS imaging Plenty of irregular/late-type systems Few genuine ellipiticals
SN Ia Stretch dependencies Stretch by galaxy star-formation activity Stretch versus mean age Star-forming Passive The majority of SN Ia come from young stellar populations 170 SNe Ia (Update from Sullivan et al. 2006; better zeropoints, host photometry, more SNe)
Recent SNLS evidence for two components for SNe Ia Older progenitor SNe Empirically, SN Rate is proportional to galaxy mass Preferentially found in old stellar environments Typically fainter with faster light-curves (low stretch) Younger progenitor SNe Empirically, SN rate is proportional to galaxy star formation rate Exclusively found in later type star-forming galaxies Typically brighter with slower light-curves (high stretch) (Extreme example: SNLS-03D3bb?)
Recent SNLS evidence for two components for SNe Ia Older progenitor SNe Empirically, SN Rate is proportional to galaxy mass Preferentially found in old stellar environments Typically fainter with faster light-curves (low stretch) Younger progenitor SNe Empirically, SN rate is proportional to galaxy star formation rate Exclusively found in later type star-forming galaxies Typically brighter with slower light-curves (high stretch) (Extreme example: SNLS-03D3bb?) Could evolution between the two components with redshift distort the dark energy signal?
SN population drift? Relative mix of evolves with redshift A+B predictions, but similar for any two component model Sullivan et al. 2006
Evolution in Stretch? Gaussians – predicted evolution from A+B model Average stretch, and thus average intrinsic brightness of SNe Ia evolves with redshift but if stretch correction works perfectly, this should not affect cosmology Nearby z<0.75 z>1 Howell et al. 2007
Effect on cosmology Extreme case using SNLS 1st year Use only s<1 SNe Ia at z<0.4, only s>1 SNe at z>0.4 Effects of evolution smaller than error budget for determination of <w>, must be studied closely to determine the effect on measuring w(a) SNLS yr 1 N: 115 = 1.6 = 1.8 w = -1.05 0.09 M = 0.27 0.02 Yr 1 s split N: 56 = 1.4 = 1.8 w = -0.92 0.15 M = 0.28 0.03
Stretch correction across environments Rest-frame B composite light-curve Conley et al. 2006 No evidence for gross differences between light-curves in passive and active galaxies
SN Subsets Split by host galaxy Passive α=1.34 ± 0.25 β=2.52 ± 0.2 σ~0.10 mag <w>=-0.88±0.11 Star-forming α=1.19 ± 0.15 β=2.71 ± 0.2 σ~0.140 mag <w>=-1.04±0.08 Preliminary Problems: Low-redshift sample very small, Malmquist correction likely to be different
Varying metallicity changes line blanketing in the UV Do SNe Ia Evolve? UV Spectrum Probes Metallicity Lentz et al. (2000)
High S/N spectra of SNLS SNe Ellis, Sullivan et al. 2007
Light-curve width dependence Implications for JDEM: k-corrections must improve in accuracy
Summary • SNLS is a well-controlled, calibrated and understood experiment • Current SN Ia measurement determine <w> to ~ 6-7% • SNLS is the best cosmological SN Ia dataset available • In 2-3 years, 4-5% will be achieved • Colour is the critical correction to SN Ia distances; currently can only be handled empirically • SNe Ia have a range of progenitor ages • Impacts on light-curve shape: faster/older & slower/younger • SNe in passive galaxies are better standard candles? • More homogeneous stellar population? Less dust?