Download
1 / 13
130 likes | 336 Vues
At some point someone will ask you for metrics about your SQL Servers. Why do you want to track the installation date? If you already collect the above information and the date SQL Server was installed, you can show more information about your SQL environment, leverage it to show trends and even present it to management as an argument for hiring more DBAs. You may want also opt to use one of the SERVERPROPERTY values. SERVERPROPERTY also has a parameter that will allow you to return the edition, which may be useful for reporting on, especially if there is to be a consolidation project. Click the link to download the SQL tools: http://dell.to/1b2CAjp

E N D
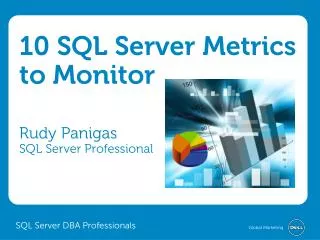
10 SQL Server Metrics to Monitor Rudy PanigasSQL Server Professional SQL Server DBA Professionals
10 key metrics At some point, someone will ask you for metrics about your SQL Servers. When that time comes, you should be prepared with some of the following metrics: • How many SQL Servers are installed? • How many SQL Servers are used as production? • How many SQL Servers are used as development? • How many SQL Servers are used as quality assurance (QA) and user acceptance testing (UAT)? • How many SQL Servers are used as disaster recovery? • How many SQL Servers are at your location, cloud, other sites, etc.? • What applications are using each SQL Server(s)? • How many databases do you have? • How big are the databases and total size of disk use? • What were the installation dates of the SQL Servers?
Installation date Why do you want to track the installation date? If you already collect the above information and the date the SQL Server was installed, you can: • Show more information about your SQL environment • Leverage it to show trends • Present it to management as an argument for hiring more resources
T-SQL script Here is the SQL script that will show the SQL Server name, version of SQL Server, and the date of installation of your SQL Server: You may also want to use one of the SERVERPROPERTY values. SERVERPROPERTY also has a parameter that will allow you to return the edition, which may be useful for reporting on, especially if there is to be a consolidation project.
Sample result Here is a sample result: Execute this script on all your SQL Server and record this information. You can record the results into a spreadsheet or a table.
What to do with the data Once you have recorded this information on all of your SQL Server installations, you can then use Excel Pivots or SQL Server Reporting Services (SSRS) to create all types of interesting information: • With just a SUM of the column, you get a total SQL Server count. • If you had previous years’ totals, you can show how many SQL Servers were added this and each preceding year. • If you sort the data by year and month, you can show: • How many SQL Server instances were installed • When they were installed • The busiest time for installation
What to do with the data • If you include SQL Server versioning, you can then break down the report based on versions with totals and when they were installed. • With this data you can also see which SQL Servers need to be upgraded and show corresponding names and departments – if you have collected this information. • Sorting the data by types (production, development, UAT, etc.) you can show how many of each type you have. • If you collected department data you can also show how many SQL Servers each one has. • With Excel Pivots tables you can produce a graph showing current growth rate and trend future growth. There is a lot of information you can pass on to management that will show interesting trends. This type of reporting helps management to better understand your SQL Server environment.
Graphical representation of results This graph shows the total number of SQL Server installations from 2006 to 2013 (blue) and the trend of SQL Server growth (black). According to this graph, the number of installed SQL Servers will be almost doubled by 2020.
Graphical representation of results This graph shows SQL Server versions and the years they were installed.
Graphical representation of results This graph shows how many SQL Servers were installed by department and the breakdown of how they are used. We see that both the Finance and Marketing departments have more development SQL Servers than production and that Finance has the least SQL Servers at the disaster recover (DR) site.
Importance of data collection These examples how you can use the collected information to help you in many ways. Initially, the collection may be painful, however, you can design more automated ways of attaining the information. Once maintained, you will quickly see the importance.
Learn MoreView the Original Blog PostDownload FREE ToolsFollow @SQLDBApros on Twitter