
Iso electric point
E N D
Presentation Transcript
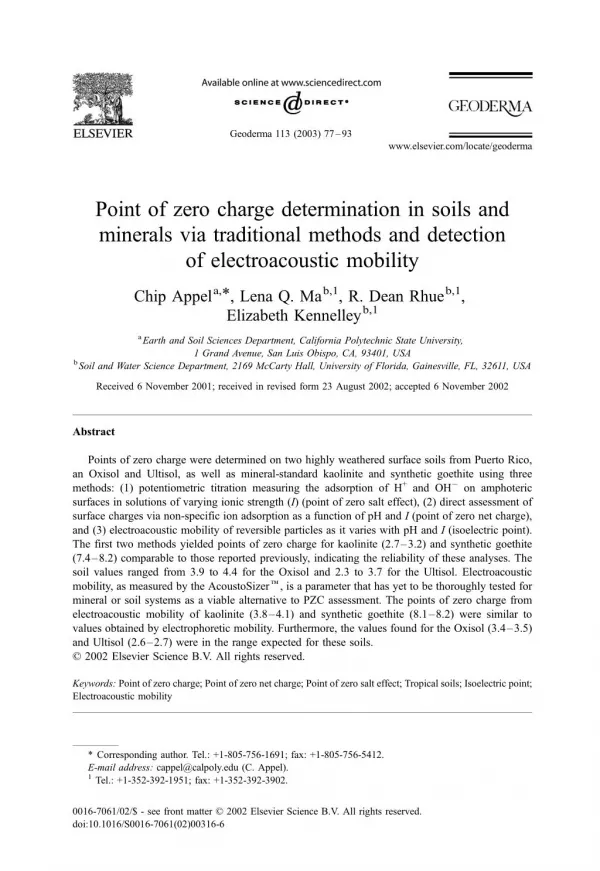
Geoderma 113 (2003) 77–93 www.elsevier.com/locate/geoderma Point of zero charge determination in soils and minerals via traditional methods and detection of electroacoustic mobility Chip Appela,*, Lena Q. Mab,1, R. Dean Rhueb,1, Elizabeth Kennelleyb,1 aEarth and Soil Sciences Department, California Polytechnic State University, 1 Grand Avenue, San Luis Obispo, CA, 93401, USA bSoil and Water Science Department, 2169 McCarty Hall, University of Florida, Gainesville, FL, 32611, USA Received 6 November 2001; received in revised form 23 August 2002; accepted 6 November 2002 Abstract Points of zero charge were determined on two highly weathered surface soils from Puerto Rico, an Oxisol and Ultisol, as well as mineral-standard kaolinite and synthetic goethite using three methods: (1) potentiometric titration measuring the adsorption of H+and OH?on amphoteric surfaces in solutions of varying ionic strength (I) (point of zero salt effect), (2) direct assessment of surface charges via non-specific ion adsorption as a function of pH and I (point of zero net charge), and (3) electroacoustic mobility of reversible particles as it varies with pH and I (isoelectric point). The first two methods yielded points of zero charge for kaolinite (2.7–3.2) and synthetic goethite (7.4–8.2) comparable to those reported previously, indicating the reliability of these analyses. The soil values ranged from 3.9 to 4.4 for the Oxisol and 2.3 to 3.7 for the Ultisol. Electroacoustic mobility, as measured by the AcoustoSizerk, is a parameter that has yet to be thoroughly tested for mineral or soil systems as a viable alternative to PZC assessment. The points of zero charge from electroacoustic mobility of kaolinite (3.8–4.1) and synthetic goethite (8.1–8.2) were similar to values obtained by electrophoretic mobility. Furthermore, the values found for the Oxisol (3.4–3.5) and Ultisol (2.6–2.7) were in the range expected for these soils. D 2002 Elsevier Science B.V. All rights reserved. Keywords: Point of zero charge; Point of zero net charge; Point of zero salt effect; Tropical soils; Isoelectric point; Electroacoustic mobility * Corresponding author. Tel.: +1-805-756-1691; fax: +1-805-756-5412. E-mail address: cappel@calpoly.edu (C. Appel). 1Tel.: +1-352-392-1951; fax: +1-352-392-3902. 0016-7061/02/$ - see front matter D 2002 Elsevier Science B.V. All rights reserved. doi:10.1016/S0016-7061(02)00316-6
78 C. Appel et al. / Geoderma 113 (2003) 77–93 1. Introduction Soils in the humid tropics (Oxisols, Ultisols, Andisols and acid Alfisols) cover nearly 22% of the earth’s surface. These soils are dominated by minerals and amorphous colloids possessing amphoteric surfaces. This poses far-reaching implications for soil management in agriculture and retention of ionic soil contaminants (Naidu et al., 1997; Sanchez, 1976; Uehara and Gillman, 1981). Surface charge in these systems depends on activities of potential-determining ions (H+and OH?) and electrolyte concentrations (ionic strength, I) (van Olphen, 1977). Depending on soil pH, these surfaces can bear net negative, or positive, or no charge. The pH where the net total particle charge is zero is called the point of zero charge (PZC), which is one of the most important parameters used to describe variable-charge surfaces (Morais et al., 1976; Parks and de Bruyn, 1961). If the pH of a soil is above its PZC the soil surface will have a net negative charge and predominantly exhibit an ability to exchange cations (CEC— exchange of one positive ion by another), while the soil will mainly retain anions (electrostatically) if its pH is below its PZC (AEC—exchange of one negative ion for another). Several methods have been proposed for determination of the point of zero charge in soils and other materials dominated by variable surface-charge colloids. In soils, researchers have generally relied on potentiometric titration, which assesses changes in surface potential with changes in the activities of H+and OH?, to determine the point of zero salt effect (PZSE) or point of zero net proton charge (PZNPC). They have also used non-specific ion adsorption, which measures changes in the electrostatic adsorption of a cation and anion with changes in the activities of H+and OH?, to find the point of zero net charge (PZNC) (Marcano-Martinez and McBride, 1989; Parker et al., 1979; van Raij and Peech, 1972). Some researchers have proposed methods based on the mobility of charged particles in an electrical field (Findlay et al., 1996; O’Brien and Rowlands, 1993). However, most of the research has focused on the use of these techniques for charge determination of pure mineral specimens (e.g. kaolinite, gibbsite, etc.) and not whole soils. The heterogeneous nature of soils, in terms of particle size and extreme variety in types of charged particles, makes detection of mobility difficult in these complex systems. A detailed review and discussion of surface charging as well as the various points of zero charge can be found in Barrow (1987), Lewis-Russ (1991) and Sposito (1989). Several articles have been published comparing potentiometric titration (PZSE) to ion adsorption techniques (PZNC) for the determination of the point of zero charge in soils and pure minerals. Generally, there is not a good correlation between the two measures (Gallez et al., 1976; Hendershot and Lavkulich, 1983; Marcano-Martinez and McBride, 1989; van Raij and Peech, 1972). This has been attributed to the presence of permanent negative-charge colloids in the soil system (Marcano-Martinez and McBride, 1989), the presence of strongly adsorbed Al3 +remaining on permanent negative-charge sites in the system via the potentiometric titration method as opposed to its displacement during ion adsorption measurements (van Raij and Peech, 1972), and differences in pH where a balance exists between the adsorption of H+and OH?(potentiometric titration) and the anion and cation of an electrolyte (ion adsorption) (Hendershot and Lavkulich, 1983).
79 C. Appel et al. / Geoderma 113 (2003) 77–93 Lavardiere and Weaver (1977) found good agreement between PZSE and PZNC for several spodic horizons dominated by sesquioxides and organic matter. This condition may be fulfilled only when the amount of H+or OH?adsorbed on exchange sites equals that of the index cation or anion, respectively, suggesting that hydration energies of competing ions are similar (Sposito, 1981). Yopps and Fuerstenau (1964) found excellent agreement between the points of zero charge determined by potentiometric titration and microelectrophoresis when analyzing mineral-standard a- alumina (Al2O3). Current literature does not include work comparing point of zero charge values found by chemical methods such as potentiometric titration (PZSE) and ion adsorption (PZNC) with electroacoustic determinations, which were done using an AcoustoSizerk (AZR) in our study. The AZR relates particle sound wave gener- ation, the electroacoustic effect, to the frequency-dependent electrophoretic mobility from which the zeta potential (f; electrical potential in the double layer at the plane of shear which is the interface between the Stern and diffuse layers) is calculated by the instrument’s software. Advantages of this technique compared to other instruments using electrophoretic mobility for size and/or charge determina- tions (e.g. dynamic light-scattering spectroscopy and microelectrophoresis) include the ability to work with relatively high suspension concentrations (1–40% compared to concentrations of <0.01% with the other techniques), negating the need for dilution of slurries. Furthermore, whereas microelectrophoresis, potentiometric titra- tion and ion adsorption generally require the preparation of several, pH-adjusted samples to span a particular point of zero charge, the AZR equipped with auto- titrator and large sample cell (350 ml) allows point of zero charge determinations using a single sample. Therefore, a material’s point of zero charge may be determined in a fraction of the time (1.5 h) required for its measurement via traditional methods. It usually takes several hours to days to determine points of zero charge via potentiometric titration, ion adsorption assay and most micro- electrophoresis techniques. There are, however, some potential drawbacks to using the AZR for surface charge determination of soils. The instrument relies on the measurement of sound-wave generation by relatively small charged particles. A potential disadvantage for its use in point of zero charge determinations for soils is the narrow range of particle sizes (0.1–10 Am) where surface charge measurements may be obtained. Moreover, the instrument was not specifically developed to resolve the electrophoretic mobility of charged particles in whole soils. Therefore, its ability to accurately determine f potential in these complex systems has not been demonstrated. Due to the above listed advantages as well as potential drawbacks to electroacoustic mobility determinations in complex soil and mineral systems, the instrument was used along with two common chemical methods to determine the points of zero charge of several amphoteric materials. The objectives of this research were (i) to assess the pH- dependent surface charge of mineral-standard kaolinite, synthetic goethite, as well as surface horizons of an Oxisol and Ultisol from Puerto Rico and (ii) to determine the various points of zero charge of these materials via potentiometric titration, ion adsorption, and electroacoustic mobility.
80 C. Appel et al. / Geoderma 113 (2003) 77–93 2. Materials and methods 2.1. Materials The surface horizons (0–15 cm) of two tropical soils were obtained from the island of Puerto Rico. An Oxisol (clayey, oxidic, isohyperthermic Typic Acrorthox) sampled near Mayaguez on the west coast and an Ultisol (clayey, mixed, isohyperthermic Typic Tropohumult) taken from the central mountainous area near Corozal were used in this study. Poorly crystallized kaolinite (KGa-2) (powder form) was purchased from the Source Clay Minerals Repository (Columbia, MO). X-ray diffraction analysis using CuKa radiation and aluminum side powder mounts (Whitting and Allardice, 1986), coupled with thermal gravimetric analysis (TGA), confirmed that the samples contained kaolinite as the dominant mineral phase (>93% pure). Goethite was synthesized using the methods of Atkinson et al. (1967) and Coughlin and Stone (1995). Briefly, 6.5 l of 0.5 M Fe(NO3)3 dissolved in 0.21 M HNO3was slowly added to 12.6 l of 1.55 M KOH, in plastic, while sparging with air. The suspension was then aged for 36 h in an oven at 70 jC. After the supernatant was siphoned off, the suspension was washed 10 times with NANOpurek (Barnstead/Thermolyne, Chicago, IL) water to wash out any entrained salts. Surface properties of goethite prepared in a similar manner are discussed elsewhere (Balistrieri and Murray, 1981, 1982). Suspended material was deposited on ceramic tiles for XRD analysis (Whitting and Allardice, 1986). The X-ray diffractograms coupled with TGA data confirmed Fe(O)OH to be the only mineral phase present. The material was then freeze-dried overnight at ?46 jC to obtain a solid, and the solid material was passed through a 0.5-mm sieve. The BET-N2specific surface areas (Quantachrome, 1996) of kaolinite and goethite were 18.1 and 70.2 m2g? 1, respectively. 2.2. General analytical methods Pertinent properties of the soils used in this study were obtained using standard methods (Appel and Ma, 2002) and are presented in Table 1. The pH readings were taken in water at 1:10 soil/water ratio in order to model the CEC and AEC values (same soil/ water ratio) measured in the ion adsorption portion of the experiment. Effective CEC was extrapolated from ion adsorption curves at 0.001 M ionic strength (I) at field pH (1:10 soil/ water ratio) as this I was most representative of the soil I. Table 1 Pertinent chemical and physical characteristics of soil samples pHa Mineralogyb Texturec (%) Sample Organic matter (%) ECEC (me kg? 1) Surface area (m2g? 1) k>go>gicq k>q>s>go>m Oxisol Ultisol 4.05 1.86 5.2 4.9 9.0 50.1 10–34–56 12–29–59 41.9 37.8 a1:10 soil/water ratio. bk=kaolinite, go=goethite, gi=gibbsite, s=smectite, q=quartz, m=mica. cSand–silt–clay.
81 C. Appel et al. / Geoderma 113 (2003) 77–93 2.3. Determination of electric charge All experiments for charge determination were carried out under ambient laboratory conditions (temperature=25F3 jC), as prior experiments showed that ingress of CO2 into solutions containing synthetic goethite was not important in lowering pH. 2.4. Potentiometric titration Prior to analysis, soils were washed with 0.001 M HCl by shaking for 2 h followed by centrifugation which lowered soil pHc1.5 units compared to a water wash at the same soil to water ratio. This was performed to saturate the materials with H+in an effort to drive any reactions involving consumption of H+(i.e. amorphous mineral dissolution) not resulting in surface charge. Mineral dissolution was tested via analysis of Al, Fe and Si in the supernatant compared to amounts of these elements extracted by washing with 0.0005 M CaCl2. Analysis of the elements was performed by inductively coupled argon plasma- atomic emission spectroscopy (ICAP-AES) and indicated that mineral dissolution was insignificant resulting in <0.1% of total Al, Fe or Si being dissolved. In order to ensure low amounts of salt were entrained, washing was repeated with NANOpurek water until no precipitate (AgCl) was formed in the supernatant upon addition of 2 M AgNO3, when the electrical conductivity (EC) was <0.01 dS m? 1. For surfaces dominated by variable charge colloids, a theoretically distinct point (pH) exists where titration curves for different concentrations of non-specifically adsorbing electrolytes intersect which is called the point of zero salt effect (PZSE). The potentio- metric titration method of Marcano-Martinez and McBride (1989) and van Raij and Peech (1972) was used to determine the PZSE for all materials. To 50 ml beakers were added 4 g air-dried material and 10 ml of electrolyte solution (0.1, 0.01 and 0.001 M NaCl). Increasing amounts of standardized 0.1 M HCl or 0.1 M NaOH were then added in order for the pH of the samples, for each electrolyte concentration, to range from c2 to 9. The beakers were then filled to 25 ml with NANOpurek water. Samples were then covered and mixed several times by manual agitation over an incubation period of 7 days. Bioactivity in the supernatant solutions was not apparent throughout the course of the experiment. Soil pH was measured at the end of the incubation period. Amounts of H+and OH?adsorbed by a material were determined by subtracting the amount of HCl or NaOH required to bring 10 ml of electrolyte plus 15 ml of water (no soil) to the same pH. 2.5. Ion adsorption Determination of CEC and AEC for charged surfaces (dominated by variable-charge colloids) as a function of pH and I can be accomplished via the ion adsorption method. The point (pH) where non-specific surface adsorption of anions and cations is equivalent is defined as the PZNC. Positive and negative charges were estimated by the measurement of Na+and Cl?retention in soils and pure minerals as a function of pH and I. A modified method of Marcano-Martinez and McBride (1989) was used. Air-dried samples of 2 g (<0.5 mm) were placed in preweighed 30 ml polyethylene centrifuge tubes to which 20 ml
82 C. Appel et al. / Geoderma 113 (2003) 77–93 of 1 M NaCl was added. The samples were shaken for 1 h and centrifuged, with the supernatant being discarded. Amounts of 20 ml of 0.5 M NaCl were then added to the tubes, with sample pH being adjusted with HCl or NaOH to span the expected points of zero net charge. This was followed by 12 h of shaking, centrifugation and supernatant removal. The 0.5 M NaCl wash and pH adjustments were performed two more times, with shaking times of 1 h. The rigorous washing procedure was carried out to ensure exchange sites were saturated with Na+and Cl?. Five washes were then performed with 20 ml of 0.01 and 0.001 M NaCl, with pH readjustment and shaking for 1 h between washes. This was done to determine the effect of varying I on retention of ions. Ionic strengths of typical non-saline temperate-region soils are <0.05 M (McBride, 1994), whereas their tropical counterparts are <0.005 M (Gillman and Bell, 1978). The I values of the two soils used in this study were estimated at 0.003 M each, following the method of Gillman and Bell (1978). After the final NaCl wash, supernatant pH (equilibrium pH) was measured. The supernatants were discarded and samples weighed to compensate for any entrained NaCl solution. Adsorbed Na+and Cl?were then displaced by five washings with 20 ml aliquots of 0.5 M NH4NO3. Extracts were combined and filtered through 0.45 Am Milliporek nylon filters and stored in a refrigerator prior to analysis. Concentrations of Na+ (determined by ICAP-AES) and Cl?(found colorimetrically; Domask and Kobe, 1952) displaced were corrected for occluded NaCl in the soil volume and used as measures of negative and positive charges, respectively. 2.6. Electrophoretic mobility The pH at which the f vanishes is called the PZC. The PZC is usually obtained by determination of the pH at which soil particles do not move in an applied electric field (electrophoretic mobility) (Sposito, 1989). The isoelectric point (IEP), as measured by electrophoretic techniques, can be defined as the pH where electrophoretic mobility is zero or electrokinetic charge measurements show a sign reversal for f (van Olphen, 1977). Thus, the PZC is synonymous with the IEP. The isoelectic point (IEP) of all materials was ascertained with the AZR (Colloidal Dynamics, Warwick, RI) which relies on measurement of electroacoustic parameters for determination of particle charge and size. Assessment of electroacoustic principles specifically related to the operation of the AZR have been described in detail elsewhere (Colloidal Dynamics, 1996; O’Brien et al., 1995; O’Brien and Rowlands, 1993; Rowlands et al., 1997). Briefly, application of an alternating electrical field to a colloidal suspension results in the generation of acoustic waves created by the compression and rarefaction of the suspension. This phenomena is known as the Electrokinetic Sonic Amplitude (ESA) effect from which the AZR is able to determine particle size and charge. The instrument applies the variable voltage to parallel plate electrodes that contact the colloidal suspension. The electrical field created by the alternating voltage causes the particles to move at certain velocities depending upon their size, charge (f potential), and the frequency of the applied field (assuming a density difference between the particles and the supporting fluid matrix). Particle movement results in sound wave generation (ESA effect) and measurement of this effect yields information about the particles’ motion.
83 C. Appel et al. / Geoderma 113 (2003) 77–93 These measurements enable the determination of suspended particle velocity over a range of eight excitation frequencies (0.3–11.5 MHz) which, grouped together, is called the dynamic mobility spectrum of the particle. Particle charge and size can be extracted from the dynamic mobility spectrum of the particle and related to its frequency-dependent electrophoretic mobility from which the instrument’s software calculates the f potential (O’Brien et al., 1995). At the highest frequency of the dynamic mobility spectrum (11.5 MHz), inertia becomes an important factor for particles <0.1 Am in diameter making this the lower limit for size detection. However, the AZR is capable of reliably measuring the f potential for particles at and slightly below this size. At the other extreme, the mobility of particles with diameters >10 Am is too small to accurately measure. This explains why this value represents the upper limit for size and charge determinations (O’Brien et al., 1995). It is important to point out that the reactive size fraction of soils (e.g. clay fraction at <2 Am) fall within the f potential detection limits of the instrument. Furthermore, the AZR allows resolution of the charge and size of spheres and spheroids (discs and rods) which is necessary for accurate descriptions of soils and soil minerals. This is because the dynamic mobility spectrum for a spheroidal particle has a very similar shape to that of a sphere (Colloidal Dynamics, 1996; O’Brien et al., 1995). Comparison of f potential data for minerals obtained by microelectrophoresis and the AZR agrees reasonably well indicating the accuracy of the AcoustoSizerk (Table 2). Soils were prepared following the same protocols as described for potentiometric titration. Prior to f potential measurements by the AZR, equipped with double-junction pH glass electrode and auto-titrator, samples were mixed mechanically in 0.01 and 0.001 M NaCl and made up to concentrations of 5% (except for synthetic goethite which was made up to 0.5%). The titrants were 1 M HCl and 1 M NaOH and samples were titrated cF1 pH units from their points of zero charge as determined by potentiometric titration and ion adsorption, with a back-titration being performed on all samples. The back-titration was carried out in order to determine if the material surfaces changed, as measured by changes in f potential, from titrating on both the acid and alkaline side of the IEP. Table 2 Comparison of AcoustoSizerk f potentials (mV) with those using standard microelectrophoretic measurements AcoustoSizerk Microelectrophoresisa Colloid pH TiO2 4.0 4.0b 8.2 9.0 3.5 8.9 10.0b 4.4 9.8 5.0 37 40 ?6 ?20 26 ?39 ?35 ?28 ?37 47 38 50 (57) ?6 ?22 24 ?43 ?42 (?51) ?26 ?43 58 (53) Si3N4 Kaolin Alumina From Colloidal Dynamics (1996). aMeasured with Rank Bros Mark II and Malvern ZetaSizer (in parentheses). bMaterial from a different source.
84 C. Appel et al. / Geoderma 113 (2003) 77–93 2.7. Statistical methods One-way analysis of variance was used to statistically compare differences between methods and electrolyte concentrations (ion adsorption and electrophoretic mobility procedures only). 3. Results and discussion 3.1. Potentiometric titrations The PZSE is the pH where the net adsorption of potential-determining ions, H+and OH?, on variable-charge surfaces is independent of electrolyte concentration. Titration curves at varying I will show a common intersection point (PZSE) when pH is plotted vs. surface charge or amounts of acid or base added. In our experiment, the two soils clearly demonstrated points where salt concentration had no effect on adsorption of potential- determining ions over the pH ranges measured (Fig. 1). However, the PZSE of mineral- standard kaolinite and synthetic goethite demonstrated a slightly different trend than the soils. The titration curves of the mineral samples did not follow the usual trend of higher electrolyte concentration resulting in higher pH below the PZSE. It is possible, at lower pH values, that protons were predominantly consumed in mineral dissolution reactions instead of generating surface charge (Lindsay, 1979). This would have the effect of narrowing the margin of difference between various electrolyte titration curves, which was evident. It is postulated that the effect described above was not as important for the two soils, which had varied mineralogy (Table 1). Moreover, all the samples demonstrated increased separation between titration curves at pH values above the PZSE. Above this point material buffering capacity is reduced, which is manifested via relatively small increases in pH resulting in large expansion in charge generation. Fig.1clearlydisplays,forbothsoilsandthepureminerals,thatPZSEwasontheacidside or below the point where equal amounts of acid and base were added (acid side of the zero point of titration). This may be explained by the fact that the current method did not account for the surface charge on the solids at the onset of the potentiometric titration. The adsorbed H+and OH?were measured relative to a blank solution and not to a common value of surfacechargeonthesolids.Thiswasespeciallyevidentforsyntheticgoethite.Thismaterial had relatively high surface area (70.2 m2g? 1) and was prepared in strong base (1.55 M KOH). Thus,its surface washighlybufferedand abletoadsorb protonswellbelow thepoint of equal addition of acid and base before showing a crossover of I curves at pH 7.9. Despite greater percentage of organic matter in the Oxisol soil (4.05%) as compared to the Ultisol soil (1.86%), which tends to lower the point of zero charge (van Raij and Peech, 1972), the PZSE of the Oxisol (4.2) was higher than that of the Ultisol (3.7). Fox (1982) found similar values (4.4 and 3.2, respectively) for these soil series when employing a comparable methodology. Though the mineralogy of the two soils consisted of relatively large quantities of high point of zero charge sesquioxides (f44% and 15%, respectively), the presence of organic matter, kaolinite, and SiO2in these samples tends to reduce the point of zero charge. Furthermore, larger quantities of Fe and Al oxides (PZSE>6.5) in the
85 C. Appel et al. / Geoderma 113 (2003) 77–93 Fig. 1. Potentiometric titration curves of an Oxisol (a), Ultisol (b), kaolinite (c) and goethite (d) as a function of pH at different ionic strengths. CA=concentrated acid and CB=concentrated base.
86 C. Appel et al. / Geoderma 113 (2003) 77–93 Oxisol (<2 Am fraction) gave this soil a higher PZSE whereas the Ultisol possessed greater amounts of low point of zero charge minerals (PZSEs for SiO2c2 and kaolinite c2.5–3.5) as well as some permanent surface-charge minerals, which gives rise to a slightly lower PZSE (Gallez et al., 1976; Parks and de Bruyn, 1961). Kaolinite had a PZSE of 2.8 in this study, which is consistent with work done by Gallez et al. (1976) and Hendershot and Lavkulich (1983) (PZSEs=2.8 and <3, respectively). Literature-reported PZSE values of synthetic goethite are between 7 and 9 (Atkinson et al., 1967; Schwertmann and Taylor, 1989). The result found in this experiment (7.9) was in the middle of this range. 3.2. Ion adsorption The amounts of adsorbed Na+and Cl?of the four materials used in this study varied as a function of both pH and I (Fig. 2). The pH where cation adsorption was equal to anion adsorptionwasobtainedbylocatingthepointofintersectionoftheqNa(measureoftheCEC) and qCl(measure of the AEC) curves. All materials exhibited a decrease in the PZNC (increase in negative surface charge) with increasing I. This is consistent with the theory of the electric double layer (EDL) for variable-charge colloids which states that increasing solution I yields an increase in the magnitude of the surface charge. Our samples were net negatively charged at equilibrium solution pH (Table 1), thus, increases in solution I should and did decrease their PZNC values. Furthermore, this phenomenon has been described by other researchers (Chorover and Sposito, 1995; van Raij and Peech, 1972). Based on the Gouy–Stern theory of the EDL (van Olphen, 1977), for a constant surface-potential material, the magnitude of its surface charge is proportional to the square root of the electrolyte concentration. Therefore, under equilibrium conditions for a material with a net negatively charged surface (pH>PZNC), increasing solution I will result in increased negative surface charge and lowered PZNC as surface protons are exchanged for electrolyte cations (Uehara and Gillman, 1981). This was demonstrated by Gallez et al. (1976), Morais et al. (1976) and van Raij and Peech (1972) for highly weathered tropical soils from Nigeria and Brazil. Furthermore, soil pH determined at a 1:10 soil/water ratio (Table 1) compared to a 1:10 soil to either 0.01 or 0.001 M NaCl ratio showed the pH values in water to be above those determined in salt solution (Fig. 2). Therefore, under natural condition, both soils in our study had net negatively charged surfaces (pH>PZNC). The PZNCs of the Oxisol, in solutions of 0.01 and 0.001 M NaCl, were 3.9 and 4.4, respectively. These values for the Ultisol were lower at 2.3 and 2.6 for the 0.01 and 0.001 M NaCl solutions (Table 3), respectively. The difference in CEC and AEC of the Ultisol as compared to the Oxisol appeared largely due to mineralogy. The presence of colloids possessing permanent negative charges (f17% smectite) as well as an abundance of low point of zero charge minerals (f23% SiO2; PZNC 2.0–3.0) in the Ultisol resulted in the PZNC being nearly unobserved over the pH ranges measured, especially at 0.01 M NaCl (Fig. 2b, Table 3). The mineral standards had PZNC values close to those found in the literature for the same specimens. Mineral-standard kaolinite had a PZNC of 3.2 in 0.001 M NaCl. This value is slightly lower than the range of PZNC values of 4.0–5.0 for this material as reported by Sposito (1989) and Zhou and Gunter (1992). Sposito (1989) has reported the
87 C. Appel et al. / Geoderma 113 (2003) 77–93 Fig. 2. AEC and CEC of an Oxisol (a), Ultisol (b), kaolinite (c) and goethite (d) as a function of pH and ionic strength. qNa(measure of CEC) and qCl(measure of AEC) are absolute values of surface charge as estimated by the retention of Na+and Cl?, respectively. Solid lines and dashed lines were determined in 0.01 M NaCl and 0.001 M NaCl, respectively. PZNC of synthetic goethite to be between 7.0 and 8.0. These values are in close agreement to the numbers determined in this experiment (7.4 and 8.2) for the same mineral. 3.3. Electrophoretic mobility The PZC (or IEP) of a variable-charged particle in solution is defined as the pH where the net total particle charge is zero. As mentioned previously, this parameter is commonly
88 C. Appel et al. / Geoderma 113 (2003) 77–93 Table 3 Summary of points of zero charge of two soils, kaolinite, and goethite as measured by potentiometric titration (PZSE), ion adsorption (PZNC) and electroacoustic mobility (IEP) Sample PZSE PZNC IEP NaCl (mol l? 1) NaCl (mol l? 1) 0.01 0.001 0.01 0.001 Oxisol Ultisol Kaolinite Goethite 4.2 3.7 2.8 7.9 3.9 2.3 2.7 7.4 4.4 2.6 3.2 8.2 3.4 2.6 3.8 8.2 3.5 2.7 4.1 8.1 determined from electrophoretic mobility (van Olphen, 1977); however, such a measure- ment for soils, using an acoustic detector, has not yet been reported in the literature. The heterogeneous nature of surface charge in soils results in the formation of an IEP continuum. For example, at pH 5, a soil possessing only kaolinite and goethite would have negatively charged kaolinite surfaces and positively charged goethite surfaces. Kaolinite particles would move toward a positively charged pole while the opposite would be true for goethite. Thus, the IEP of a soil, as measured by the AZR, would be an average of the mobilities of the charged particles (c0.1–10 Am particle size) in the system. Fig. 3 presents f potentials of the soils and mineral-standards as obtained by the AZR. Individual IEPs were found by first titrating with acid to pH<IEP followed by addition of base back to a pH value near the starting point. It was expected that the IEP of the first pass (i.e. first titration from alkaline to acid side of the IEP) would be higher than the IEP of the second pass (i.e. second titration from acid side to alkaline side of IEP). This was because additions of acid or base were increasing solution I and should have compacted the EDL which subsequently should have decreased f and, thus, the measured IEP. In all cases, however (except for the Oxisol curve at 0.001 M NaCl), the IEP was greater when back- titrating with base, which appears to be a systematic effect. The differences in IEP when performing the back-titration were generally small, and in all cases, IEPs (as displayed in Table 3) were obtained via interpolation between the two curves. It is reasonable to conclude that, the generally slight differences in the curves may have arisen from mineral dissolution and re-precipitation reactions that occurred during the titrations, which would change the surface-charge properties of the materials. Furthermore, in the case of synthetic goethite, the titration curves suggest few or no problems related to the ingress of CO2and subsequent formation of HCO3 high surface area. This was because the IEP changed little over the course of the experiment (f+0.2 pH units). In an experiment determining f potentials for gibbsite between pH 7 and 12 (in air), Rowlands et al. (1997) did not observe problems associated with formation of HCO3 The materials displayed only slight differences in IEPs between the two background electrolyte solutions (Table 3). The IEPs were generally a tenth to a few tenths of a pH unit lower in the 0.01 M solutions as compared to the 0.001 M ones. These findings are consistent with the theory of the EDL. Theory states that increasing electrolyte concen- tration results in a decrease in the thickness of the double layer, lowering colloid mobility, f potential, and charge at the plane of shear while shifting the IEP to lower values (Zhang ?which was most likely due to its ?.
89 C. Appel et al. / Geoderma 113 (2003) 77–93 6 6 a a) Acid titration 4 4 2 Base titration I = 0.01 M 2 0 -2 0 Acid titration -4 -2 -6 Base titration -4 -8 I = 0.001 M Titration start -10 -6 Titration start a) -12 -8 2 3 4 5 2 3 4 5 6 6 b) b) 4 4 2 2 0 0 -2 -2 Zeta potential (mV) -4 -4 Titration start Titration start -6 -6 -8 -8 1 2 3 4 4 1 2 3 6 8 c) c) 6 4 4 2 2 0 0 -2 -2 -4 -4 -6 Titration start Titration start -8 -6 2 3 4 5 6 2 3 4 5 6 8 8 d) d) 6 6 4 4 2 2 0 0 -2 -2 -4 -4 Titration start Titration start -6 -6 6 7 8 9 10 6 7 8 9 10 pH Fig. 3. IEP, as found by the AZR, of an Oxisol (a), Ultisol (b), kaolinite (c) and goethite (d) as a function of pH and ionic strength. and Zhao, 1997). Research performed by O’Brien et al. (1995) at low electrolyte concentrations, (<0.01 M) using the AZR, confirm this trend. They have shown that increases in electrolyte concentration resulted in decreases in the electrophoretic mobility as well as the absolute value of charge at the plane of shear for titanium oxide and gibbsite. However, in our experiment, this trend was reversed with synthetic goethite, though the difference was small (0.1 pH unit).
90 C. Appel et al. / Geoderma 113 (2003) 77–93 There is little information available on electroacoustic detection of particle mobility for determination of amphoteric particle IEPs. However, the same mineral-standard kaolinite as used in this research was found to have an IEP range of 3–5 (averagec4.0F0.9) as found by electrophoretic mobility techniques by several researchers (Braggs et al., 1994; Carroll-Webb and Walther, 1988; Parks, 1967). Our values of 3.8 and 4.1 (0.01 and 0.001 M NaCl, respectively) found by the AZR were within the range and near the average of those values found above. Furthermore, according to Bleam and McBride (1984), Djafer et al. (1991), Matis et al. (1999), Su and Suarez (1997), Weesner and Bleam (1998) and Zhang (1997) synthetic goethite, prepared in a similar fashion as for the present study, has IEP values as measured by electrophoretic mobility ranging from 7.5 to 9.3 with the average of their reported values being c8.6F0.6. This can be compared to our values of 8.2 and 8.1 (0.01 and 0.001 M NaCl, respectively) as determined by the AZR (Table 3). Therefore, the IEPs found by the AZR for goethite were, much like kaolinite, within the range of previously reported data for this material. 3.4. Comparison of the three methods One-way analysis of variance showed that differences between methods (PZSE vs. PZNC in 0.001 M NaCl vs. IEP in 0.001 M NaCl; PZSE vs. PZNC in 0.01 M NaCl vs. IEP in 0.01 M NaCl) and electrolyte concentrations (PZNC in 0.01 vs. 0.001 M NaCl; IEP in 0.01 vs. 0.001 M NaCl; and PZNC vs. IEP in 0.01 and 0.001 M NaCl) were, in all cases, not significant (p>0.05). Furthermore, ANOVA analyses between the PZSE, PZNC, and IEP values in 0.001 M NaCl gave a slightly higher p value (1.00) than the similar comparison where PZNC and IEP were determined in 0.01 M NaCl (p=0.94), suggesting more similarity between the 0.001 M values as compared to the 0.01 M values. This is worth mentioning, for the I in tropical soils is generally low (e.g., <0.005 M) and the I values for the soils used in this study were estimated to be c0.003 M each. In spite of the statistical similarities between methods, the assumption that PZSE=PZNC=IEP was not true in our experiment for the soils and kaolinite as these materials possessed permanent charge. Furthermore, from Table 3, a practical difference was observed between the points of zero charge. Considering only PZC values at I=0.001 M plus the PZSE data, though not significantly different, the range spanned from 0.3 pH units (goethite samples) to 1.3 pH units (Ultisol samples). 4. Conclusions The three definitions of points of zero charge used in this experiment—PZSE, PZNC and IEP—measure theoretically unique types of charge (Barrow, 1987; Lewis-Russ, 1991; Sposito, 1989). Though analysis of variance yielded no significant differences between the points of zero charge, there were practical differences between the results generated by potentiometric titration (PZSE), ion adsorption (PZNC) and electroacoustic detection of particle mobility (IEP). The question remains as to whether or not the points of zero charge determined, accurately describe the parameter(s) they were measuring. Making comparisons of points
91 C. Appel et al. / Geoderma 113 (2003) 77–93 of zero charge of mineral-standard kaolinite and synthetic goethite with literature values, as determined by other researchers, yielded points of zero charge that fell within the ranges of those reported. This is especially noteworthy for the AZR as the potential drawbacks (see Introduction) to its use in complex systems were not necessarily realized when determining particle mobility via electroacoustic detection in our study. It is reasonable to conclude points of zero charge determined by the AZR for kaolinite and goethite, in our experiment, adequately modeled this parameter. Furthermore, the ability of the instrument to quickly (1.5 h) resolve mobility of small (0.1–10 Am—which is within the active/clay fraction of soils) charged spheres, discs, and rods demonstrate its use for the determination of f potential and IEP in soils. Though more work must be performed using this instrument to enable generalizations regarding the AZR’s perform- ance in point of zero charge determinations for soil systems, the results are encouraging inasmuch as the time required to generate this value was drastically reduced compared to the potentiometric titration and ion adsorption methods. Acknowledgements The authors gratefully acknowledge Gustavo Martinez, University of Puerto Rico, Mayaguez, for obtaining the soil samples used in this research. We also thank Willie Harris for his helpful insights regarding our findings and also to he and Keith Hollien for their assistance and expertise in ascertaining sample mineralogy. We are grateful to Kevin Powers and Gill Brubaker of the Engineering Research Center, University of Florida, for allowing us to use the Acoustosizerk. We would also like to thank Brian McNeal and Vimala Nair, Soil and Water Science Department, University of Florida, for their constructive suggestions in reviewing the first draft of our paper. Finally, the principal author would like to thank Gaston Amedee, California Polytechnic State University, San Luis Obispo, for instructing him in tropical soil chemistry as well as the Trace Metal Chemistry Laboratory Group, Soil and Water Science Department, University of Florida, for their assistance throughout the course of this experiment. References Appel, C., Ma, L.Q., 2002. Concentration, pH, and surface charge effects on Cd and Pb sorption in three tropical soils. J. Environ. Qual. 31, 581–589. Atkinson, R.J., Posner, A.M., Quirk, J.P., 1967. Adsorption of potential-determining ions at the ferric oxide- aqueous electrolyte interface. J. Phys. Chem. 71, 550–558. Balistrieri, L.S., Murray, J.W., 1981. The surface chemistry of goethite (FeOOH) in major ion seawater. Am. J. Sci. 281, 788–806. Balistrieri, L.S., Murray, J.W., 1982. The adsorption of Cu, Pb, Zn, and Cd on goethite from major ion seawater. Geochim. Cosmochim. Acta 46, 1253–1265. Barrow, N.J., 1987. Reactions with variable charge soil. Fertil. Res. 14, 1–100. Bleam, W., McBride, M.B., 1984. Cluster formation versus isolated-site adsorption. A study of Mn(II) and Mg(II) adsorption on boehmite and goethite. J. Colloid Interface Sci. 103, 124–132. Braggs, B., Fornasiero, D., Ralston, J., Smart, R.S., 1994. The effect of surface modification by an organosilane on the electrochemical properties of kaolinite. Clays Clay Miner. 42, 123–136.
92 C. Appel et al. / Geoderma 113 (2003) 77–93 Carroll-Webb, S.A., Walther, J.V., 1988. A surface complex reaction model for the pH-dependence of corundum and kaolinite dissolution rates. Geochim. Cosmochim. Acta 52, 2609–2623. Chorover, J., Sposito, G., 1995. Surface charge characteristics of kaolinitic tropical soils. Geochim. Cosmochim. Acta 59, 875–884. Colloidal Dynamics, 1996. AcoustoSizer Users Manual. Colloidal Dynamics, Warwick, RI. Coughlin, B.R., Stone, A.T., 1995. Nonreversible adsorption of divalent metal ions (MnII, CoII, NiII, CuII, and PbII) onto goethite: effects of acidification, FeIIaddition, and picolinic acid addition. Environ. Sci. Technol. 29, 2445–2455. Djafer, M., Khandal, R.K., Terce, M., 1991. Interactions between different anions and the goethite surface as seen by different methods. Colloids Surf. 54, 209–218. Domask, W.C., Kobe, K.A., 1952. Mercurimetric determination of chlorides and water-soluble chlorohydrins. Anal. Chem. 24, 989. Findlay, A.D., Thompson, D.W., Tipping, E., 1996. Electrokinetic properties of oxide particles in natural waters. Colloids Surf. 111, 203–212. Fox, R.L., 1982. Some highly weathered soils of Puerto Rico: 3. Chemical properties. Geoderma 27, 139–176. Gallez, A., Juo, A., Herbillon, A., 1976. Surface and charge characteristics of selected soils in the tropics. Soil Sci. Soc. Am. J. 40, 601–608. Gillman, G.P., Bell, L.C., 1978. Soil solution studies on weathered soils from tropical North Queensland. Aust. J. Soil Res. 16, 67–77. Hendershot, W.H., Lavkulich, L.M., 1983. Effect of sesquioxide coatings on surface charge of standard mineral and soil samples. Soil Sci. Soc. Am. J. 47, 1252–1260. Lavardiere, M.R., Weaver, R.M., 1977. Charge characteristics of spodic horizons. Soil Sci. Soc. Am. J. 41, 505–510. Lewis-Russ, A., 1991. Measurement of surface charge of inorganic geologic materials: techniques and their consequences. In: Sparks, D.L. (Ed.), Advances in Agronomy. Academic Press, Boston, MA, pp. 199–243. Lindsay, W.L., 1979. Chemical Equilibria in Soils. Wiley, New York, NY. Marcano-Martinez, E., McBride, M.B., 1989. Comparison of the titration and ion adsorption methods for surface charge measurements in Oxisols. Soil Sci. Soc. Am. J. 53, 1040–1045. Matis, K.A., Zouboulis, A.I., Zamboulis, D., Valtadorou, A.V., 1999. Sorption of As(V) by goethite particles and study of their flocculation. Water Air Soil Pollut. 111, 297–316. McBride, M.B., 1994. Environmental Chemistry of Soils. Oxford Univ. Press, Oxford, England. Morais, F.I., Page, A.L., Lund, L.J., 1976. The effect of pH, salt concentration, and nature of electrolytes on the charge characteristics of Brazilian tropical soils. Soil Sci. Soc. Am. J. 40, 521–527. Naidu, R., Kookana, R.S., Sumner, M.E., Harter, R.D., Tiller, K.G., 1997. Cadmium sorption and transport in variable charge soils: a review. J. Environ. Qual. 26, 602–617. O’Brien, R.W., Rowlands, W.N., 1993. Measuring the surface conductance of kaolinitic particles. J. Colloid Interface Sci. 159, 471–476. O’Brien, R.W., Cannon, D.W., Rowlands, W.N., 1995. Electroacoustic determination of particle size and zeta potential. J. Colloid Interface Sci. 173, 406–418. Parker, J.C., Zelazny, L.W., Samprath, S., Harris, W.G., 1979. A critical evaluation of the extension of zero point of charge (zpc) theory to soil systems. Soil Sci. Soc. Am. J. 43, 668–674. Parks, G.A., 1967. Aqueous surface chemistry of oxides and complex oxide minerals. In: Stumm, W. (Ed.), Equilibrium Concepts in Natural Water Systems. American Chemical Society, Washington, DC, pp. 121–160. Parks, G.A., de Bruyn, P.L., 1961. The zero point of charge of oxides. J. Phys. Chem. 66, 967–973. Quantachrome, 1996. Nova 1200 Gas Sorption Analyzer Manual. Quantachrome, Boyton Beach, FL. Rowlands, W.N., O’Brien, R.W., Hunter, R.J., Patrick, V., 1997. Surface properties of aluminum hydroxide at high salt concentration. J. Colloid Interface Sci. 188, 325–335. Sanchez, P.A., 1976. Properties and Management of Soils of the Tropics. Wiley, New York, NY. Schwertmann, U., Taylor, R.M., 1989. Iron oxides. In: Dixon, J.B., Weed, S.B. (Eds.), Minerals in Soil Environ- ments. Soil Science Society of America, Madison, WI, pp. 379–438. Sposito, G., 1981. The operation definition of the zero point of charge in soils. Soil Sci. Soc. Am. J. 45, 292–297. Sposito, G., 1989. The Chemistry of Soils. Oxford Univ. Press, New York, NY.
93 C. Appel et al. / Geoderma 113 (2003) 77–93 Su, C.M., Suarez, D.L., 1997. In site infrared speciation of absorbed carbonate on aluminum and iron oxide. Clays Clay Miner. 45, 814–825. Uehara, G., Gillman, G.P., 1981. The Mineralogy, Chemistry and Physics of Tropical Soils with Variable Charge Clays. West View Press, Boulder, CO. van Olphen, H., 1977. An Introduction to Clay Colloid Chemistry. Wiley, New York, NY. van Raij, B., Peech, M., 1972. Electrochemical properties of some Oxisols and Alfisols of the tropics. Soil Sci. Soc. Am. Proc. 36, 587–593. Weesner, F.J., Bleam, W.F., 1998. Binding characteristics of Pb2+ on anion-modified and pristine hydrous oxide surfaces studied by electrophoretic mobility and X-ray absorption spectroscopy. J. Colloid Interface Sci. 205, 380–389. Whitting, L.D., Allardice, W.R., 1986. X-ray diffraction techniques. In: Clute, A. (Ed.), Methods of Soil Analy- sis. Part 1, 2nd ed. Agronomy, vol. 9. Am. Soc. Argon, Madison, WI, pp. 331–362. Yopps, J.A., Fuerstenau, D.W., 1964. The zero point of charge of alpha-alumina. J. Colloid Sci. 19, 61–71. Zhang, H., 1997. Electrokinetic properties. In: Yu, T.R. (Ed.), Chemistry of Variable Charge Soils. Oxford Univ. Press, New York, NY, pp. 219–271. Zhang, X.N., Zhao, A.Z., 1997. Surface charge. In: Yu, T.R. (Ed.), Chemistry of Variable Charge Soils. Oxford Univ. Press, New York, NY, pp. 17–63. Zhou, Z., Gunter, W.D., 1992. The nature of surface charge of kaolinite. Clays Clay Miner. 40, 365–368.