AFLP and microsatellite analysis
AFLP and microsatellite analysis. Amplified Fragment Length Polymorphism. Pros: Large number of markers with relatively little lab effort No prior information about genome needed Genome wide overage Small amount of DNA needed Cons:

AFLP and microsatellite analysis
E N D
Presentation Transcript
AFLP and microsatellite analysis
Amplified Fragment Length Polymorphism Pros: Large number of markers with relatively little lab effort No prior information about genome needed Genome wide overage Small amount of DNA needed Cons: Markers are dominant (i.e. heterozygotes are scores as homozygotes) Can be tedious to score Size homoplasy Reproducibility?
STEP 2: Pre-selective PCR EcoRI PRE-SELECTIVE PRIMER GTAGACTGCGTACC AATT CA CA AT GAGTCCTGAGTA MseI PRE-SELECTIVE PRIMER
GTAGACTGCGTACC AATT CACT STEP 3: Selective PCR SELECTIVE PRIMER FAM EcoRI SELECTIVE PRIMER (labeled) GTAGACTGCGTACC AATT CA CA AT GAGTCCTGAGTA GACA AT GAGTCCTGAGTA MseI SELECTIVE PRIMER
MseI EcoRI MseI MseI MseI MseI MseI MseI MseI MseI MseI MseI MseI MseI MseI MseI EcoRI EcoRI EcoRI MseI MseI EcoRI MseI MseI MseI MseI MseI MseI MseI MseI MseI MseI EcoRI MseI MseI MseI MseI MseI MseI MseI MseI MseI MseI MseI EcoRI: 6bp cutter --> one cut every 4096 bp MseI: 4bp cutter --> one cut every 256 bp Selective PCR product contains many unlabeled fragments that will not be visible on ABI
Number of bands in AFLP profile is determined by 1 Genome size: larger genome ---> more bands 2 Number of selective nucleotides in selective primers 3 Dilution of PCR product Low (noise) peaks get magnified Why optimize number of bands? 1 Size homoplasy !!!!! 2 Difficult to score
Choosing selective primer combinations Use many of these to get enough markers (cheap) And use these to optimize number of bands EcoR1-AGT MseI-CGT EcoR1-AGC MseI-CGA MseI-CGC MseI-CGG etc. MseI-CGTG MseI-CG Use few of these (expensive), but allows use of multiple colors (multiplex run on ABI) An additional nucleotide reduces number of peaks 4-fold One less nucleotide increases number of peaks 4-fold
Reproducibility High reproducibility has generally been reported However, DNA quality is crucial component (use same DNA extraction protocol for all samples!) Assess quality of data by repeating several samples from scratch i.e. starting with DNA extraction
1 Well separated peaks 2 Right number of peaks 2 Little noise 3 Peaks are distributed across size range 4 High level of Polymorphism Note: Genome size is correlated with noise level Around 20% of primer combinations provide profiles that are suitable for high throughput genotyping. Ideal AFLP profile
Optimizing AFLP reactions 1 DNA quality 2 DNA quality A successful AFLP analyses depends crucially on this 3 DNA quality 4 Increase restriction time to 2 hours 5 Increase ligation time to 16 hours 6 Use fresh T4 ligase 7 Increase amount of DNA (rest-lig) added to pre-selective PCR (15 ul DNA’ in 50ul reaction) 8 Reduce amount of DNA in Selective PCR 9 Increase amount of cycles in Selective PCR 10 Increase amount of TAQ in Selective PCR 11 Several people have reported better results with TaqI vs MseI (but this requires different adaptors)
Scoring AFLP profiles Normalize samples: Arbitrary cut-off peak height has to be used and this needs to be relative since different samples have different intensity. Set high cut-off for inclusion as marker (that is, at least one individual has to have this cut-off peak height), then reduce peak height for scoring the presence/absence for remainder of individuals. In Genemapper do not use auto-bin option. Make your own bins Analyze all samples for the same primer set in the same project. This allows you to assess the reliability of the marker by scrolling across samples. Also prevents you from including non-polymorphic markers. Also, normalization performed on all samples at the same time. Do not include peaks that do not show clear presence or absence in most cases. Score blindly to avoid bias. Check for overflow from different dye
Genemapper Freeware for scoring AFLP from ABI runs: Genographer v 1.6 GenoProfiler 2.0
A few population genetic programs for AFLP analyses RAPDFst: Fst(Lynch and Milligam, 1994) MVSP, NTSYS: Jaccard coeficient, Nei and Li (1979) Arlequin, TFPGA: Amova Genalex: st, analog of Fst, Amova Structure, BAPS: inference of population structure. Hickory: Bayesian estimation of F statistics for dominant markers
A few population genetic programs for AFLP analyses RAPDFst: Fst(Lynch and Milligam, 1994) MVSP, NTSYS: Jaccard coeficient, Nei and Li (1979) Arlequin, TFPGA: Amova Genalex: st, analog of Fst, Amova Structure, BAPS: inference of population structure. Hickory: Bayesian estimation of F statistics for dominant markers Assumes H-W equilibrium
A few population genetic programs for AFLP analyses RAPDFst: Fst(Lynch and Milligam, 1994) MVSP, NTSYS: Jaccard coeficient, Nei and Li (1979) Arlequin, TFPGA: Amova Genalex: st, analog of Fst, Amova Structure, BAPS: inference of population structure. Hickory: Bayesian estimation of F statistics for dominant markers Assumes H-W equilibrium Treats multilocus data as single haplotype
A few population genetic programs for AFLP analyses RAPDFst: Fst(Lynch and Milligam, 1994) MVSP, NTSYS: Jaccard coeficient, Nei and Li (1979) Arlequin, TFPGA: Amova Genalex: st, analog of Fst, Amova Structure, BAPS: inference of population structure. Hickory: Bayesian estimation of F statistics for dominant markers Assumes H-W equilibrium Treats multilocus data as single haplotype Low information content No assumption of H-W equilibrium
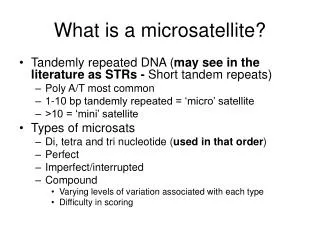
Microsatellites • * Di- or tri-nuleotide repeats • * Ubiquitous • * High mutation rate (102-106) High level of variability
Mutational mechanism Slippage during replication (also happens during PCR) ACCGAGTCGATCGTGTGTGTGTGTGTGTGTACGCTA TGGCTCAGCTAGCACACA C A C A C A C ACCGAGTCGATCGTGTGTG TGTGTGTGTGTACGCTA TGGCTCAGCTAGCACACAC ACACACACACATGCGAT C A Reduces or decreases number of repeats Slippage increases with number of repeats
This paper is particularly useful. It comes from a Lab that has isolated microsatellites from 125+ species Obtaining Microsatellites • Screening sequenced genomes • Screening enriched genomic library Glenn and Schable (2005) Methods in Enzymology 395: 202-222.
Choosing loci: • 8 - 20 repeats • uninterrupted repeats SELECTING LOCI Too few repeats Low variability Too many repeats Difficult to score, Homoplasy • Screening of loci: • Number of alleles Cloning pool of PCR amplicons, followed by labeled PCR • Heterozygosity, • allelic richness M13 labeled primers
Forward primer Forward primer Reverse primer M13 primer FAM M13 tailed primer Boutin-Ganache et al (2001) Biotechniques 31, 26-28 Forward primer Reverse primer (Low concentration) M13-tail
Some scoring issues Great looking heterozygote
Some scoring issues Extra peak because of partial A overhang addition of Taq Stutter bands of the two high peaks due to slippage
Some scoring issues Heterozygote
Some scoring issues A single large allele with many repeats Lots of slippage
Some scoring issues 35 repeats Increase in slippage with increase in repeat number
Some scoring issues How many alleles?
Some scoring issues Find a heterozygote that clearly shows the shape of a single allele
Some scoring issues The alleles
Some scoring issues Electrophoresis artifacts (Fernando et al (2001) Mol. Ecol. Notes 1, 325-328) The figures shows the difference in peak shape of the same PCR products loaded at different concentration
Some scoring issues Electrophoresis artifacts (Fernando et al (2001) Mol. Ecol. Notes 1, 325-328) Do not overload your gel ! Also keep in mind that in different PCR’s the left peak or the right peak may be dominant
Optimizing PCR Avoid Null Alleles (or try to) • Minimize annealing temp lowest temp that produces clean bands • MgCl2 concentration increase reduces specificity • Different species design new primers (if possible) (In my limited experience with cross species amplification null alleles can be big problem) Reduce stutter: • Reduce number of cycles • Reduce amount of MgCl2 • Touchdown PCR • 2/2/8 PCR (2 sec denat, 2 sec anneal, 8 sec extens.) • BSA, DMSO Addition of A • Increase final extension time • Add Pigtail (GTTTCTT) on 5’end of reverse primer to facilitate addition of A overhang Seems to be most successfull
Analysis Issues Population subdivision causes both. Null alleles only cause HW disequilibrium. Microsats biggest problem Null alleles Are loci in HW equilibrium? Linkage disequilibrium? Possible solutions: Remove loci from analysis (if enough loci are available) Check if HW disequilibrium influences results by temporarily removing affected loci. Adjust allele and genotype frequencies (Microchecker)
Some population genetics software Microsatellite toolkit: Excel plug-in for creating Arlequin, FSTAT and Genepop files. Microchecker: Estimate null allele frequency. Adjust allele frequencies. Arlequin: HW equilibrium, Linkage Disequilibrium, Fst, exact test of differentiation, Amova, Mantel test FSTAT: Allelic richness, Fst per locus (to check contribution of each locus to observed pattern of differentiation) Structure, BAPS: Population structuring, population assignment. Migrate: Estimates of effective population size and migration rates Bottleneck: Check for very recent population bottlenecks