Download

1 / 5
0 likes | 10 Vues
Learn how Power BI dashboards provide interactive reporting and real-time updates compared to traditional Excel-based financial reports.

E N D
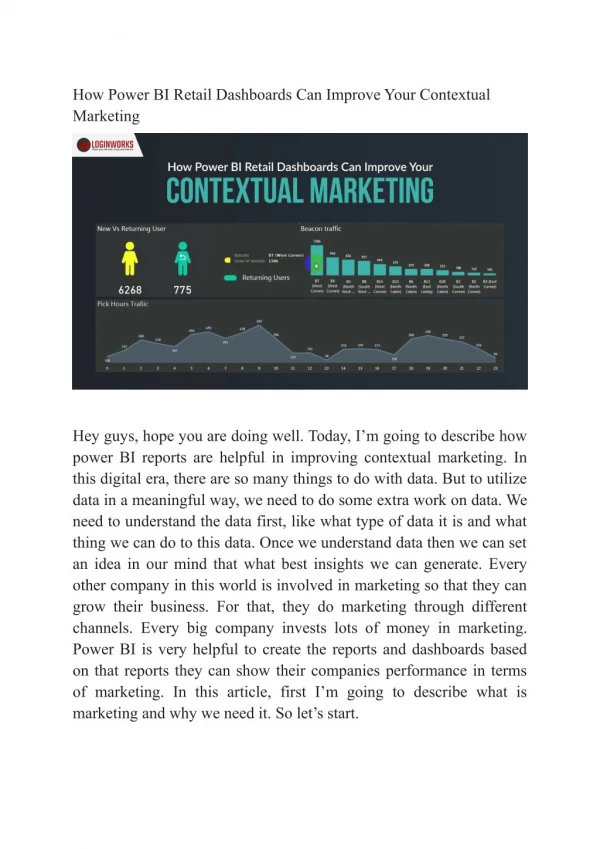
Power BI Finance Dashboard vs Excel Financial Reporting Financial reporting plays a central role in every organization. It helps businesses track performance, control expenses, monitor revenue, and plan for future growth. For years, Excel has been the preferred tool for preparing financial reports. However, as businesses grow and data becomes more complex, many organizations are shifting toward modern dashboard solutions such as Power BI. Understanding the difference between a Power BI finance dashboard and traditional Excel financial reporting can help businesses choose the right approach for their needs. Excel Financial Reporting: Familiar and Flexible Website:https://blogs.knowledgeexcel.com/power-bi/power-bi-finance-dashboard-vs-excel-financi al-reporting Email: info@knowledgeexcel.com
Excel has long been trusted for financial analysis. It allows users to create spreadsheets, apply formulas, generate pivot tables, and design charts. Many finance professionals are comfortable working in Excel because it offers flexibility and control. Some key strengths of Excel include: ● Custom calculations using formulas ● Easy creation of financial models ● Familiar interface for most professionals ● Suitable for small to medium datasets Excel works well when data volume is manageable and reporting needs are straightforward. It is particularly effective for one-time analysis or detailed financial modeling. However, as datasets grow larger and reporting becomes more frequent, maintaining multiple spreadsheets can become time-consuming. Manual updates increase the risk of errors, and sharing reports across teams may lead to version confusion. Power BI Finance Dashboard: Visual and Dynamic A Power BI finance dashboard takes financial reporting to another level by focusing on visualization and interactivity. Instead of reviewing rows of numbers, users can explore financial data through dynamic charts, graphs, and performance indicators. Power BI connects directly to multiple data sources and updates reports automatically when new data is added. This reduces manual work and ensures that reports reflect the most recent information. Key advantages of a Power BI finance dashboard include: ● Real-time data updates ● Interactive filtering and drill-down features ● Clear visual representation of KPIs ● Centralized dashboard for multiple reports ● Easier sharing across teams The dashboard format provides a high-level overview while still allowing deeper analysis. For example, a finance manager can view total revenue on the main screen and then drill down into specific departments or regions for detailed insights. Website:https://blogs.knowledgeexcel.com/power-bi/power-bi-finance-dashboard-vs-excel-financi al-reporting Email: info@knowledgeexcel.com
Comparing Visualization Capabilities One of the biggest differences between Excel and Power BI is visualization. While Excel supports charts and graphs, they are generally static. Updating them often requires manual adjustments. Power BI dashboards, on the other hand, are designed for visual storytelling. Multiple visuals can be combined into a single dashboard, and interactions between charts allow users to explore relationships in the data instantly. Clicking on one visual automatically updates others, providing a seamless analysis experience. This level of interactivity makes it easier for leadership teams to understand financial performance at a glance. Handling Large Data Sets Excel performs well with moderate amounts of data. However, very large datasets can slow down performance and make files difficult to manage. Power BI is built to handle larger volumes of data more efficiently. It processes data quickly and maintains responsiveness even when multiple reports are connected. For organizations dealing with high transaction volumes or multiple business units, this scalability is an important advantage. Collaboration and Sharing Sharing Excel reports often involves sending files through email or storing them in shared folders. This can lead to multiple versions of the same report, causing confusion about which file is current. Power BI dashboards can be published and shared online, allowing authorized users to access a single version of the report. This improves collaboration and ensures everyone is working with consistent data. When to Use Excel and When to Use Power BI Both tools have their place in financial reporting. Website:https://blogs.knowledgeexcel.com/power-bi/power-bi-finance-dashboard-vs-excel-financi al-reporting Email: info@knowledgeexcel.com
Excel is ideal for: ● Detailed financial modeling ● Scenario analysis ● Smaller datasets ● One-time reports Power BI is better suited for: ● Ongoing performance monitoring ● Interactive dashboards ● Real-time financial tracking ● Enterprise-level reporting Many organizations use both tools together. Excel may be used for detailed calculations, while Power BI presents the final results in a visually engaging dashboard. Making the Right Choice Choosing between a Power BI finance dashboard and Excel financial reporting depends on the size of the organization, the complexity of financial data, and reporting frequency. Businesses that require real-time insights and interactive reports often find Power BI to be more efficient. Meanwhile, Excel remains valuable for in-depth financial analysis and modeling tasks. The key is not to replace one tool entirely but to understand how each can serve specific financial reporting needs. Conclusion Excel has been a dependable tool for financial reporting for many years, offering flexibility and familiarity. However, as organizations demand faster insights and more interactive reporting, Power BI finance dashboards provide a modern and efficient alternative. By combining strong visualization capabilities, real-time updates, and easier collaboration, Power BI enhances how financial data is presented and understood. Whether used independently or alongside Excel, it empowers businesses to make clearer, more informed financial decisions. Website:https://blogs.knowledgeexcel.com/power-bi/power-bi-finance-dashboard-vs-excel-financi al-reporting Email: info@knowledgeexcel.com
Website:https://blogs.knowledgeexcel.com/power-bi/power-bi-finance-dashboard-vs-excel-financiWebsite:https://blogs.knowledgeexcel.com/power-bi/power-bi-finance-dashboard-vs-excel-financi al-reporting Email: info@knowledgeexcel.com