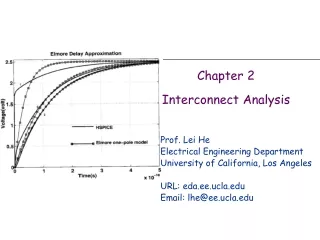
Chapter 2: Housing Market Analysis
Chapter 2: Housing Market Analysis. Chapter 2: Housing Market Analysis. Section 1: Housing Supply for Owners and Renters Section 2: Age of Housing Units Section 3: Type of Housing Units Section 4: Condition of Housing Units Section 5: Housing Cost and Value

Chapter 2: Housing Market Analysis
E N D
Presentation Transcript
Chapter 2: Housing Market Analysis • Section 1: Housing Supply for Owners and Renters • Section 2: Age of Housing Units • Section 3: Type of Housing Units • Section 4: Condition of Housing Units • Section 5: Housing Cost and Value • Section 6: Housing Availability and Vacancy • Section 7: Special Needs Housing Supply • Section 8: Subsidized Units City of Tucson and Pima County CON Plan FY2006-10
Section 1: Housing Supply by Rental and Ownership Status • 64% of the occupied housing units in Pima County (214,000 total) are ownership units. • 36% of the housing stock (119,000) are rental units. • 67% of the occupied housing units in Urban County (49,111) are ownership units. • 33% of the housing stock (24,249) are rental units. City of Tucson and Pima County CON Plan FY2006-10
Housing Supply by Rental and Ownership Status • 54% (103,229) of the housing stock in Tucson is ownership units. • 46% (89,717) of the housing stock is rental units (US Census, 2000). City of Tucson and Pima County CON Plan FY2006-10
Figure 13 – Pima County Renter-Occupied Housing Units (Census 2000) City of Tucson and Pima County CON Plan FY2006-10
Section 2: Age of Housing Units • Over 70% of the housing units were constructed after 1970; 94% after 1950. • Twice as many houses were built from 1970-1989 than were built from 1950-1969. • Construction of new housing units fell off somewhat in the 1980s, but increased marginally in the 1990s. • In Pima County 62,800 dwelling units will reach the age of at least 50 years old by 2010 City of Tucson and Pima County CON Plan FY2006-10
Age of Housing Units, Urban County • Over 74% of the housing units were constructed after 1970; 95% after 1950. • The market for home construction in Urban County peaked in the 1970s. • The housing market slowed somewhat during the 1980s, but rebounded in the 1990s. City of Tucson and Pima County CON Plan FY2006-10
Manufactured Housing and Mobile Homes • There are a total of 39,441 manufactured/mobile homes in Pima County. Nearly one half (48%) were built prior to 1979. City of Tucson and Pima County CON Plan FY2006-10
Lead Based Paint Hazards • Lead is a highly toxic substance that can cause irreversible brain damage in children under 6 years of age. Use of lead in paint was banned in 1978. • The Arizona Department of Health Services Lead Poisoning Prevention Program identified areas of high risk (by zip code) for lead poisoning in 2003. • In Tucson, 9 zip codes were identified as having high risk for lead poisoning (85701, 85705, 85708, 85711, 85713, 85714, 85716, 85719, and 85735) City of Tucson and Pima County CON Plan FY2006-10
Figure 14 – Incidents of Lead Based Paint Poisoning (Pima County Health Dept) City of Tucson and Pima County CON Plan FY2006-10
Recent Trends in Construction Rates • After a slow-down in construction in the early 1990s, residential construction has increased in recent years (Source: Arizona Construction Report, Arizona Real Estate Center, ASU). • There were over 4,000 more residential building permits issued in 2003 than in 1997. City of Tucson and Pima County CON Plan FY2006-10
Trends in Residential Building Permits, Tucson • Construction of single-family homes has seen a significant upward trend since the early 1990s (Source: City of Tucson, Dept. of Urban Planning and Design). • Permits issued for mobile homes and multi-family homes have decreased since the mid-1990s. • The number of permits issued for townhouses has remained steady through this time period. City of Tucson and Pima County CON Plan FY2006-10
Age of Housing Stock • Houses constructed before 1980 are potential risks for lead poisoning (Lead paint was banned in 1978). • 54% of the total units (200,000) in Pima County were constructed before 1980. • In Tucson, 65% of the housing units were constructed before 1980. • In the Pima County 62,800 dwelling units will reach the age of at least 50 years old by 2010 • 53% of the housing units in Urban County were constructed before 1980 and therefore have an increased risk for lead poisoning. City of Tucson and Pima County CON Plan FY2006-10
Section 3: Type of Housing Units • In 2000, there were 366,737 housing units in Pima County. • 62% of these units are single-family structures. • In 2000, there were 81,293 housing units in Urban County. • 65% of these units are single-family structures. City of Tucson and Pima County CON Plan FY2006-10
Type of Housing Units • In 2000, there were 209,792 housing units in Tucson. • 57% of these were single-family structures. City of Tucson and Pima County CON Plan FY2006-10
Single and Multi-Family Units by Sub-Region • Tucson has a higher percentage of multi-family units (35%) and a lower percentage of single-family units (57%) as compared to Urban County or Pima County. • Urban County has the lowest percentage of multi-family units, at 21%. • Pima County has a higher percentage of mobile homes, at 13% than Tucson, with 8% mobile homes. City of Tucson and Pima County CON Plan FY2006-10
Bedrooms in Housing UnitsPima County, 2000 • There are more 3-bedroom housing units in Pima County than any other size unit. • Almost all large units are owner- occupied. • Nearly all studio units are rental housing. • Most of the rental units are 1 or 2 bedrooms. City of Tucson and Pima County CON Plan FY2006-10
Bedrooms in Housing UnitsUrban County, 2000 • There are more 3-bedroom housing units in Urban County than any other size unit. • Almost all large units are owner- occupied. • Over 80% of studio units in Urban County are rental units. • 75% of the rental units in Urban County have fewer than 3 bedrooms. City of Tucson and Pima County CON Plan FY2006-10
Section 4: Condition of Housing Units • Households living in overcrowded conditions increased by 47% in the 1990s. • Of the 23,380 overcrowded households in 2000, 46% were living in severely overcrowded conditions. • HUD defines units with 1 to 1.5 persons per room as overcrowded. • Units with more than 1.5 persons per room are considered severely overcrowded. • As evidence of need there were over 1,900 responses to housing and property complaints in 2004 City of Tucson and Pima County CON Plan FY2006-10
Section 5: Housing Cost and Value • The trends in median sale prices of residential homes was obtained from the Tucson Housing Market Letter. • In November 2004, the median sale price for a residential home in the Tucson Metro area was $187,819. • Since 1995, the median sale price of single-family homes has increased 37.3%. City of Tucson and Pima County CON Plan FY2006-10
Section 6: Housing Availability and Vacancy • 68,530 housing units were added between 1990 and 2000, an increase of 23%. • Of the units added in the 1990’s, 24% were rental units. • There was a higher growth rate in households (34%) than housing units between 1990 and 2000. • There was a decrease in overall vacancy from 12.2% (36,415) in 1990 to 9.4% (34,387) in 2000 (Source: US Census). City of Tucson and Pima County CON Plan FY2006-10
Section 7: Special Needs Housing Supply • There is an undersupply of permanent or supportive housing for people with special needs. City of Tucson and Pima County CON Plan FY2006-10
Section 8: Subsidized Units Homeless Facilities: • In 2004 there were 2,738 homeless single adults and 1,470 homeless persons in families with children for a total of 4,208 homeless persons • There are 4,489 HUD Section 8 subsidies • Public housing units totaled 1,679 units including 719 for the elderly or disabled adults and 961 units for families City of Tucson and Pima County CON Plan FY2006-10
Section 8 Assistance City of Tucson and Pima County CON Plan FY2006-10
Section 8 Assistance • As of March 2005, there were 4,489 active vouchers issued by Section 8 in Pima County. • Approximately 400 of these turned over in the previous year. • The total number of Section 8 vouchers only increased by 38 from 2002 to 2004. • Assuming that 50% of the waiting list is eventually determined to be eligible, the average wait to receive a voucher is just over 1.5 years. City of Tucson and Pima County CON Plan FY2006-10
Key Findings – Housing Market Analysis • The number of households in Pima County is growing at a faster rate than the number of housing units. There are fewer vacant housing units than in 1990. • There has been an increase in the number of households living in overcrowded conditions. • Most rental units have one or two bedrooms. Lack of larger rental units contributes to the occurrence of overcrowded conditions. • The majority of housing units in Pima County are at risk for lead paint poisoning. • There seems to be a shortage of supportive housing units for the mentally ill and persons with HIV/AIDS given the small number of units available, and the large number of these special needs populations. City of Tucson and Pima County CON Plan FY2006-10