Download

1 / 39
400 likes | 634 Vues
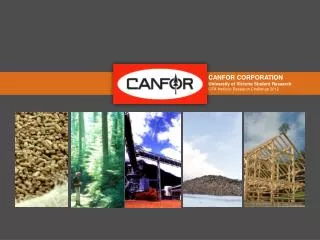
CANFOR CORPORATION University of Victoria Student Research CFA Institute Research Challenge 2012. Presentation Highlights. $14.41. Overview. Competitive Advantages. Financial Analysis. Rising Lumber Prices. Valuation. $11.70. Risks. Increasing Lumber Demand. Company Overview.

E N D
CANFOR CORPORATION University of Victoria Student Research CFA Institute Research Challenge 2012
Presentation Highlights $14.41 Overview Competitive Advantages Financial Analysis Rising Lumber Prices Valuation $11.70 Risks Increasing Lumber Demand
Company Overview North American Operations Overview Financial Analysis Source: Canfor Valuation • Headquartered in Vancouver, British Columbia • Lumber mill operations in British Columbia, Alberta, Quebec, Washington State, South Carolina, North Carolina • Largest Annual Production Capacity in North America (5.2 billion board feet) • 50.2% ownership stake in Canfor Pulp & Paper Risks
Company Overview: Major Markets Overview Financial Analysis Valuation Risks Source: FAOSTAT
Industry Overview: US Housing Starts and Lumber Prices • United States: Expected recovery in the housing market will drive up lumber prices Overview Financial Analysis Lumber Prices Valuation US Housing Starts • Potential for Supernormal Sales Growth in medium term Risks • High growth potential in US paired with • Continued new growth in China Source: Random Lengths, ForecastChart
Industry Overview: Harvesting Restrictions in China Overview Financial Analysis Valuation Restricted Risks
Industry Overview: GrowingSupply Gap in China Sawnwood Lumber Exports to China (MM Board Feet) Overview Financial Analysis Valuation Risks
Competitive Positioning: North America Competitive Positioning: China Overview Financial Analysis Valuation Risks
Financial Analysis: Return On Equity Overview Financial Analysis Valuation Risks
Financial Analysis: Lumber Sales 2010 Increasing Chinese Supply Gap Rising Lumber Price US Housing Rebound Overview Other Japan Canada Financial Analysis China United States Valuation Risks 2015E
Financial Analysis: Pulp Sales Dropping NBSK price Excess Supply Weakening Demand Overview Financial Analysis Valuation • Canfor Pulp and Paper is not a sustainable contributor to Canfor’s Value Risks
Financial Analysis: Projected Ratios Overview Financial Analysis Valuation Risks Stability Level
Valuation Overview Financial Analysis Corrects for potential inaccurate cyclical foresight of DCF Valuation Captures the effect of short-term cash flows on Canfor’s value Risks
Discounted Cash Flow: Asset Proportions Overview Financial Analysis Valuation Risks
Discounted Cash Flow: Post-Analytical FCFE Projection (2016 Onwards) FCFE Growth Cycle Illustration Overview Financial Analysis Valuation Risks 5 Year Positive Growth Min: 0%, Max: 2.5% 3 Year Negative Growth Min: 0%, Max: 2.5%
Discounted Cash Flow: Analytical Phase (2012-2015) Overview Change In Non-Cash Working Capital Financial Analysis Inflows Non-Cash Charges Net Income Valuation Outflows Capital Expenditures Risks 2012 2013 2014 2015 Net Borrowing FCFE, NET: $102.94 $104.03 $120.23 $108.40 • Continued deleveraging • Notable fixed capital investments December 2012 DCF Value: $15.40
Multiple Analysis:Similarity Assessment Overview Financial Analysis Valuation Risks
Multiple Analysis: Weighted Average Multiple Overview Financial Analysis Weighted Average EV/EBITDA: 8.80x 2012 EBITDA: $233.09M Enterprise Value: $2,051,192,000 Valuation # Shares Outstanding: 142,710,000 FY End 2012 Share Price: $14.37 Risks • West Fraser Timber and Weyerhaeuser are the most comparable to Canfor
EBITDA Regression: Variables • Method: Regress regional EBITDA over the following macroeconomic variables in each region. Overview Financial Analysis EBITDA Mean: $171 Million Valuation Risks
Final Value Overview $14.41 $14.37 Financial Analysis $15.40 Valuation $10.58 Risks
Investment Risks Overview Financial Analysis Valuation Risks
Rising Lumber Demand Strong Competitive Positioning Growing Lumber Prices BUY QUESTIONS?
Appendix N: Mountain Pine Beetle Entire Province Timber Harvesting Land Base Pine Volume Killed (millions of cubic meters