Download
1 / 65
650 likes | 952 Vues
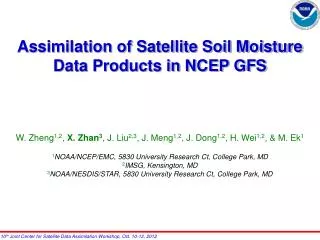
Sensitivity Study of Precipitation and T2m to Soil Moisture Using NCEP WRF Ensemble. Jun Du and George Gayno EMC/NCEP/NOAA. In Memory of Prof. Fred Sanders of MIT. (The photo taken at NCEP in July 1994). outline. Sensitivity study Basic physical mechanism understanding

E N D
Sensitivity Study of Precipitation and T2m to Soil Moisture Using NCEP WRF Ensemble Jun Du and George Gayno EMC/NCEP/NOAA
In Memory of Prof. Fred Sanders of MIT (The photo taken at NCEP in July 1994)
outline • Sensitivity study • Basic physical mechanism understanding • Soil moisture perturbation design (on going) • Ensemble system improvement (to be done) • Summary
MotivationUnder dispersive issue in warm season precipitation and near-surface variables such as T2m
Ensemble spread of 12h-apcp from NCEP 21-member SREF (Jun 2006)
0-10cm Soil moisture diff (nam-gfs) NOAH Diff ~0.1 Nam is wetter than gfs in general (except For SE US and Greenland) NOAH
(WRF_NMM model) Diff between two NMM 3h-apcp forecasts With NAM soil moisture With GFS soil moisture
(WRF_ARW model) Diff of two ARW 3h-apcp forecasts With NAM soil moisture With GFS soil moisture
Within WRF_NMM model: Impact on T2m is significant! With nam soil moisture (NMM) T2m diff (namSM – gfsSM, NMM) With gfs soil moisture (NMM)
Within WRF_ARW model: Impact on T2m is significant. With nam soil moisture (ARW) T2m diff (namSM – gfsSM, ARW) With gfs soil moisture (ARW)
(3h-apcp) Impact comparison between “IC diff” and “soil moisture diff” within WRF_NMM [note: (a) <0.1” contour not plotted, (b) it’s only 3h accumulation] Difference caused by different ICs Difference caused by different soil moisture Impact from diff soil moisture is comparable to that from diff ICs within NMM!
(3h-apcp) Impact comparison between “IC diff” and “soil moisture diff” within WRF_ARW Difference caused by different ICs Difference caused by different soil moisture Impact from diff soil moisture is comparable to that from diff ICs within ARW!
3h-apcp Impact comparison between “model difference” and “soil moisture difference” Difference caused by different models Difference caused by soil moisture diff (nmm) Impact from soil moisture diff is slightly less than but still comparable in some areas to that even from model diff (NMM vs. ARW)!
3h-apcp Impact comparison between “model difference” and “soil moisture difference” Difference caused by different models Difference caused by soil moisture diff (arw) Impact from soil moisture diff is slightly less than but still comparable in some areas to that even from model diff (NMM vs. ARW)!
T2m -- impact comparison (NMM): Soil moisture impact on T2m is bigger Than that of IC and of model difference! different IC (NMM; namSM) Diff soil moisture (nam – gfs; NMM) different models (nmm vs. arw; namSM)
T2m -- impact comparison (ARW): Soil moisture impact on T2m is comparable To that of IC but smaller than model diff Different IC (ARW, namSM) Diff soil moisture (nam – gfs; ARW) Diff models (nmm vs. arw; gfsSM)
Sensitivity/response of precip to soil moisture perturbation varies with model In WRF_NMM (less sensitive) In WRF_ARW (more sensitive)
Sensitivity/response of T2m to soil moisture varies with model: In WRF_NMM (more sensitive) In WRF_ARW (less sensitive)
Physical mechanism: soil moisture evapotranspiration partitioning of net available surface thermal energy between latent heat and sensible heat flux (temp and moisture) convection (a) dry case: increased sensible heat will have an earlier initiation of convection (e.g. afternoon thunderstorm); (b) wet case: in contrast to “dry case”, reduced sensible heat will delay initiation convection (e.g. late night thunderstorm); (c) perturb soil moisture local thermal gradient local circulation precipitation
0-10cm Soil moisture diff (max-min) Wet ~0.5 Diff ~0.3-0.4 Dry ~0.1
With WRF_NMM model Local early morning Local afternoon T2m diff (wet – dry, NMM) T2m diff (wet – dry, NMM)
With WRF_ARW model Local afternoon Local early morning T2m diff (wet – dry, ARW) T2m diff (wet – dry, ARW)
Afternoon (dry) Afternoon (wet) Late night (wet) Late night (dry) (Aligo, Gallus and Segal, 2006 WAF)
Wet soil moisture more rainfall In general especially in mid-high Latitudes than dry soil situation Wet soil moisture Diff (wet – dry) with ARW Dry soil moisture
Wet soil moisture more rainfall In general especially in mid-high Latitudes than dry soil situation Wet soil moisture Diff (wet – dry) with NMM Dry soil moisture
Response of 3h-apcp forecast to IC difference depends on soil moisture content: More sensitive in wet condition than in dry condition (WRF_NMM) Wet soil moisture condition Dry soil moisture condition
T2m is more sensitive to IC in “dry soil” than in “wet soil” condition (WRF_NMM model) Wet soil moisture condition Dry soil moisture condition
Response of 3h-apcp forecast to IC difference depends on soil moisture content: More sensitive in wet condition than in dry condition (WRF_ARW) Wet soil moisture condition Dry soil moisture condition
T2m is similar maybe slightly more sensitive to IC in “dry soil” than in “wet soil” (WRF_ARW model) Wet soil moisture condition Dry soil moisture condition
Response of 3h-apcp forecast to model difference depends on soil moisture content: More sensitive in wet condition than in dry condition Wet soil moisture condition Dry soil moisture condition
Similar sensitivity of T2m to model difference is observed under wet vs. dry tests Wet soil moisture condition Dry soil moisture condition
Sensitivity of T2m to model diff depends on which soil moisture initial states to use With GFS soil moisture (dryer) With NAM soil moisture (wetter)
(Difference in 3h-apcp forecasts with WRF_NMM model) Due to soil moisture difference Due to atmos IC difference (benchmark)
(Difference of 3h-apcp forecasts with WRF_ARW model) Due to soil moisture difference Due to atmos IC difference (benchmark)
Difference of T2m forecasts with WRF_NMM model Due to soil moisture difference Due to atmos IC difference (benchmark)
Difference of T2m forecasts with WRF_ARW model Due to soil moisture difference Due to atmos IC difference (benchmark)
Response of T2m sensitivity to soil moisture perturbation’s spatial structure (NMM) Randomly perturbed (0.05) Uniformly perturbed (0.05)
Response of T2m sensitivity to soil moisture perturbation’s spatial structure (ARW) Uniformly perturbed (0.05) Randomly perturbed (0.05)
Response of 3h-apcp sensitivity to soil moisture perturbation’s spatial structure (NMM) Uniformly perturbed (0.05) Randomly perturbed (0.05)
Response of 3h-apcp sensitivity to soil moisture perturbation’s spatial structure (ARW) Uniformly perturbed (0.05) Randomly perturbed (0.05)
Response of T2m sensitivity to soil moisture perturbation size (NMM) Uniformly perturbed with 0.05 pert size Uniformly perturbed with 0.03 pert size
Response of T2m sensitivity to soil moisture perturbation size (ARW) Uniformly perturbed with size of 0.05 Uniformly perturbed with size of 0.03