Download
1 / 30
310 likes | 341 Vues
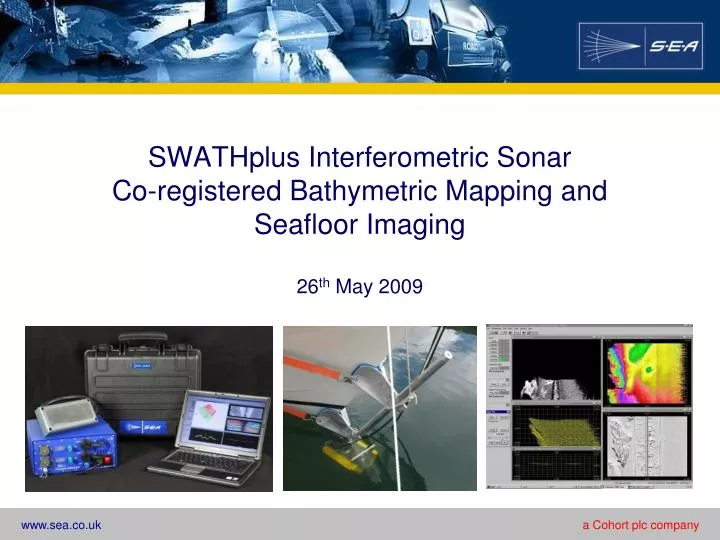
SWATHplus Interferometric Sonar Co-registered Bathymetric Mapping and Seafloor Imaging 26 th May 2009. Contents. Why SWATHplus? advantages over multibeam systems advantages over other interferometric systems Principles of Interferometry System Performance data quality and analysis

E N D
SWATHplus Interferometric SonarCo-registered Bathymetric Mapping andSeafloor Imaging26th May 2009
Contents • Why SWATHplus? • advantages over multibeam systems • advantages over other interferometric systems • Principles of Interferometry • System Performance • data quality and analysis • error analysis • analysis results, 234 kHz • uncertainty analyses • accuracy & resolution: summary • range limits • System Features • data formats • interfaces • System Components • sonar transducers & universal mounting kit • transducer interface unit (TIU) • laptop with data acquisition/processing software • Operations • calibration • data acquisition • data processing • Users & Applications • coastal surveys • pipeline inspection survey • civil engineering support • seamless water/land survey • Contact Details
Why SWATHplus? • Wide swath width in shallow water or low altitude: USGS: “Operating Swath of the bathymetric system ranged from 15 to 20 times water depth in depths less than 15m.” • Co-registered, high quality bathymetry and seafloor imagery • High data count gives high special resolution up to the swath edge • Low cost of ownership compared with most beamforming multibeams • Lightweight, compact, lower power requirement and highly portable - facilitates simple and rapid deployment • Reduced survey effort and data turn-around times • Data exportable to industry-standard applications, such as CARIS • Meets tight international data standards, such as IHO survey requirements Multibeam
advantages over multibeam echosounders • Wide swath width: • Greatly reduces survey durations • Provides total insonification of the seafloor at typical survey speeds • Portability • Low power requirements – less than 25W • High resolution and accuracy - multibeam systems suffer from poor resolution at far ranges • Simultaneous, co-registered seafloor imagery • Simplicity • Multibeam systems have angular restrictions while SWATHplus can survey a full 300o sector in standard configuration • Multibeam swath coverage is affected by roll which can lead to un-surveyed areas at the swath edges
advantages other interferometric systems • Simultaneous pinging • Double the productivity and along track coverage of alternate pinging systems • Portability • Does not require rack mounting • CAATI systems do not perform well in shallow waters; SWATHplus is: • Capable of producing a wider swath width • More cost-effective • Lighter, more compact and robust
Transmits short acoustic pulse in beam: narrow along track wide across track Receives backscattered signal Measurement of range and angle: Range from timing Angle by comparing phases at vertically-spaced transducer staves Depth calculated from range, angle and transducer motion Similar range coverage and data density to a sidescan sonar system Amplitude image is equal to that of a sidescan-only sonar system Seasurface Transducer Sediment Principles of Interferometry
System Performance • Interferometric swath bathymetry systems give 2000-8000 raw data points per side, with uncertainties (standard deviation) greater than that of multibeam systems (only producing 100-200 points per side) • Software filtering reduces uncertainty to internationally acceptable survey limits but at the expense of survey resolution • SWATHplus has been used and quality checked in surveys at all International Hydrographic Organisation (IHO) S44 accuracy orders, including Special Order • Accuracy is defined by IHO S44: • Total propagated uncertainty (TPU), • Resolution (detection of small objects) • Data coverage (accepted points per metre) • SWATHplus is essentially an angle-measuring instrument, so that depth accuracy reduces with horizontal range • It may therefore be necessary to restrict range for accuracy control
data quality and analysis • Statistical composition of interferometric data is different to that of MBES, and so data quality is sometimes questioned • Analysis of real data and mathematical modelling demonstrate that interferometers can meet tight international data standards • Analysis process: • Establish the statistical data quality requirement (IHO S44) • Use two key criteria which can be traded off against each other, using statistical processing: • Depth accuracy • Spatial resolution • Analyse real data to see whether it can fall within stated limits for these two parameters • Create an error model and validate it against the real data • Use the error model to explore the limits of conformity with IHO S44 accuracy requirements • Real data taken from SWATHplus “Shallow Survey 08” Common Data Set, (http://www.shallowsurvey2008.org): • Collected by USGS, using their own SWATHplus systems and normal operational survey procedures (speed, line spacing, etc.) • All three SWATHplus frequencies used: 468 kHz, 234 kHz & 117 kHz • Most common commercially-available swath bathymetry systems, MBES and interferometers, were used over the same data area, in similar survey conditions
error analysis • Analysis of data from SWATHplus “Shallow Survey 08” data set: • random component of horizontal and vertical uncertainties in processed SWATHplus output. • Raw data smoothed with a sliding Gaussian window: • scale size selected to maintain IHO S44 resolution (samples per metre) • Calculated standard deviations of overall vertical and horizontal variations • 95% confidence level uncertainties (as defined by S44) as a function of range (using a second sliding window) • Error model developed for SWATHplus, based on Sonar Equation analysis • Uncertainties measured from raw data compared with error model • Calculated maximum range at which IHO accuracy is achieved
analysis results, 234 kHz • Typical “Ping” • Depth versus horizontal range • Raw data: Blue • Smoothed to IHO S44 resolution requirement: Red • Raw Data Estimated Vertical Error • Vertical uncertainty (error) in raw data estimated using depth variance from highly smoothed profile
uncertainty analyses 95% Uncertainty Averaged and Compared with Model, 234 kHz • 95% Uncertainty, 234 kHz • Data smoothed at a level to maintain IHO points-per-m2 criterion • Represented as 95% uncertainty, in line with IHO S44 specification, over a second sliding window 95% Uncertainty Averaged and Compared with Model, 468 kHz
accuracy & resolution: summary • Statistical variance of raw, un-processed interferometric data is in excess of IHO S44 requirements • However, spatial resolution of interferometric data is far in excess of that called for in S44 • Simple statistical processing, as provided by SWATHplus and third-party software, brings interferometric data within S44 accuracy and resolution envelopes at swath width limits • So: SWATHplus can meet IHO S44 accuracy requirements • Range versus Depth for IHO S44 Special Order • Computed from validated model • Marked points derived from real data
range limits • Horizontal range is limited by two factors • Grazing angle • Spreading loss • Grazing-angle: • limit is dominant in shallow water, typically 7.5 times water depth • total swath width 15 times water depth • better in less that 10m depth, but reduced in poor conditions • Spreading loss depends on sonar frequency: • affects bathymetry more than sidescan data • generally visible at greater ranges, about 20% - 50% more than the depth data
System Features • Worldwide sales with systems currently operating in 5 continents • Available in 117 kHz, 234 kHz and 468 kHz operating frequencies for shallow water surveys up to 350 metres water depth: • 468 kHz available as AUV/ROV option (SWATHplus ‘Compact’) • Double-sided pinging • USB interface to any modern laptop or computer • Wide swath to depth ratio: • 10:1 on average • 20:1 in shallow water • Compact and portable: easy, rapid deployment on vessels of opportunity • Interface with real-time applications such as Fugro Starfix, QINSy, Hypack and PDS2000 • Inputs: • GPS, motion heading, speed of sound, echosounders etc. • Outputs: • Ethernet sonar records to third party software • SEA formats file • XTF imagery files
data formats • Some of the systems that have been used with SWATHplus: • It is possible to interface to other company in-house systems if required
interfaces • Real time interfaces to other survey suite sensors including: • Motion (attitude) • Speed of sound • Position and height (e.g. DGPS / RTK DGPS) • Heading • Echosounder • Arbitrary data streams • Tide height measurement can be input • From telemetry system • In post processing • Interfaces supported using RS232 serial ports & Ethernet UDP ports • Data timing from GPS/sensor time, using 1PPS input, or PC time
System Components Sonar transducers and Universal Mounting Kit Transducer Interface Unit (TIU) Laptop computer with SWATHplus sonar data acquisition & processing software
sonar transducers & universal mounting kit • Hull: • Permanent installation of transducers • Solid fixture providing: • Less motion • Ease of calibration • Good for long-term deployment • Side-pole & Bow-mount: • Ideal for Vessels of Opportunity • Rapid deployment far from base • Requires calibration on installation
Compact & highly portable USB interface Integrated power supply 1PPS timing Input transducer interface unit (TIU)
laptop with data acquisition/processing software • Real-time software: • Allows for control and set-up of the system • Processes and displays data • Gives quality control and error diagnostic information • Stores raw and processed data • Provides first pass of post-processing • Post processing software: • Converts processed data files into digital depth models • Supports automatic patch-test calibration • 3D visualisation & data cleaning • Automated data cleaning • Users may select SEA post processing software or third-party programs
Operations • Calibration • Data acquisition • Data processing
calibration • Self-calibration process built in to SWATHpluselectronics • Pre-survey: auxiliary sensor and sonar offsets and alignments measured and entered into the SWATHplus software • During survey: • Run auxiliary sensor calibration processes • Run a pattern of overlapping lines: “patch test” • After survey: • Use the patch test results to refine sensor offsets and alignments: supported by functions in the SWATHplus post-processing software • Approximately 3 hours required to collect and process the patch test
data acquisition • All real-time functions via the laptop computer including: • Controlling the sonar electronics system • Acquiring data from the sonar electronics system • Acquiring data from the auxiliary systems, through the PC's serial ports • Storing all the raw data • Converting the raw data to depth, position and amplitude (xyza) • Combining auxiliary data, such as motion, position, heading, tide and speed of sound. • Filtering the data to remove noise and unwanted targets • Displaying the data • Storing processed xyza data in a range of formats
data processing • Grid program runs off-line and performs the following functions: • Places all the processed data into a gridded digital terrain model (DTM) • Displays depth and amplitude for each node of the grid • Displays statistical information about depths in each node of the grid • The data for each ping and line of the survey are stored separately in the grid, allowing simple comparison of overlapping data sets. • The data from overlapping survey lines are compared to provide automatic post processing calibration. • Filtering and moving the data in the grid, to enable the operator to quickly and easily clean and correct the processed data. • 3D views of the data in the grid, allowing the operator to see the seabed in three dimensions. • The grid can be edited in the 3D mode. • Grid data can be stored in “point cloud” format • Every data point from the Swath program is retained in the grid allowing for high resolution views • Typically 1 day’s data acquisition can be processed in ⅓ to ½ day.
Users and Applications • Research and education • Survey companies • Navigable depth mapping • Cable route surveys • Oil & gas support surveys • Utility companies • Pipeline survey • Marine science organisations • Habitat survey • Civil engineering • Bridge, harbour structural surveys • Oil & gas • Pipeline route surveys • Pipeline integrity inspections
coastal surveys Mola di Bari, Italy • SWATHplus-H Survey • Monitor cliffs and caves • Water depths 0-30 m • Survey undertaken in 1 day with 1 day’s preparation and mobilisation • Motion sensing and positioning using a CodaOctopus F180 • Sidescan imagery shows a pipeline
pipeline inspection survey Sally Bayou and Atchafalaya Bay, Louisiana, USA • SWATHplus-H with CodaOctopus F190 • 2 day survey to look at pipeline crossings • Offshore and Bayou survey • Bayou area 2.5 km x 90 m • Offshore area 750 m x 100 m • Shows anchor drag scarring • 3-4 metres water depth
civil engineering support Lougher Bridge, Wales, • SWATHplus-Hsurvey of train bridge footings, 250m by 100m, depths 0 to 10m tovisualise wooden bridge piles. • RTK positioning and height control with a Seatex MRU6 motion sensor. • Survey undertaken within a 2 hour period as a test and no patch test undertaken.
seamless water/land survey All images courtesy of Codevintec Italy Integration of SWATHplus and scanning laser data
Contact Details Systems Engineering & Assessment Limited Offshore Division SEA House Building 660 Bristol Business Park Coldharbour Lane Bristol BS16 1EJ Telephone: +44 (0) 1373 852000 Fax: +44 (0) 117 937 5088 www.sea.co.uk