Download
1 / 1
10 likes | 23 Vues
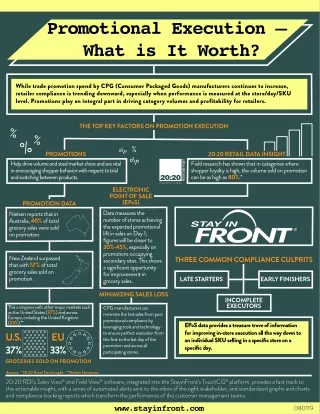
Promotions play an integral part in driving category volumes and profitability for retailers and are vital in encouraging shopper behavior with respect to trial and switching between products. This infographic presents the top key factors on promotion execution. Explore more now!

E N D
Promotional Execution — What is It Worth? While trade promotion spend by CPG (Consumer Packaged Goods) manufacturers continues to increase, retailer compliance is trending downward, especially when performance is measured at the store/day/SKU level. Promotions play an integral part in driving category volumes and prof itability for retailers. THE TOP KEY FACTORS ON PROMOTION EXECUTION % %% % % PROMOTIONS 20:20 RETAIL DATA INSIGHT Field research has shown that in categories where shopper loyalty is high, the volume sold on promotion can be as high as 80%.* % Help drive volume and steal market share and are vital in encouraging shopper behavior with respect to trial and switching between products. ELECTRONIC POINT OF SALE (EPoS) Data measures the number of stores achieving the expected promotional lift in sales on Day 1; figures will be closer to 30%-45%, especially on promotions occupying secondary sites. This shows a significant opportunity for improvement in grocery sales. PROMOTION DATA Nielsen reports that in Australia, 40% of total grocery sales were sold on promotion. New Zealand surpassed that with 57% of total grocery sales sold on promotion. THREE COMMON COMPLIANCE CULPRITS LATE STARTERS EARLY FINISHERS MINIMIZING SALES LOSS INCOMPLETE EXECUTORS This compares with other major markets such as the United States (37%) and across Europe, including the United Kingdom (33%).** U.S. CPG manufacturers can minimize the lost sales from poor promotional compliance by leveraging tools and technology to ensure perfect execution from the first to the last day of the promotion and across all participating stores. EPoS data provides a treasure trove of information for improving in-store execution all the way down to an individual SKU selling in a specific store on a specific day. EU 33% 37% GROCERIES SOLD ON PROMOTION Sources: *20:20 Retail Data Insight **Nielsen Homescan 20:20 RDI’s Sales View® and Field View® software, integrated into the StayinFront’s TouchCG® platform, provides a fast track to this actionable insight, with a series of automated alerts sent to the inbox of the right stakeholder, and standardized graphs and charts and compliance tracking reports which transform the performance of the customer management teams. 080119 www.stayinfront.com