Download
1 / 8
90 likes | 169 Vues
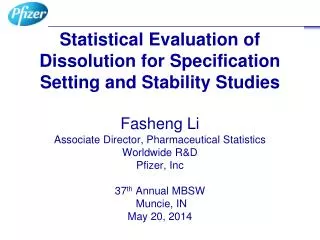
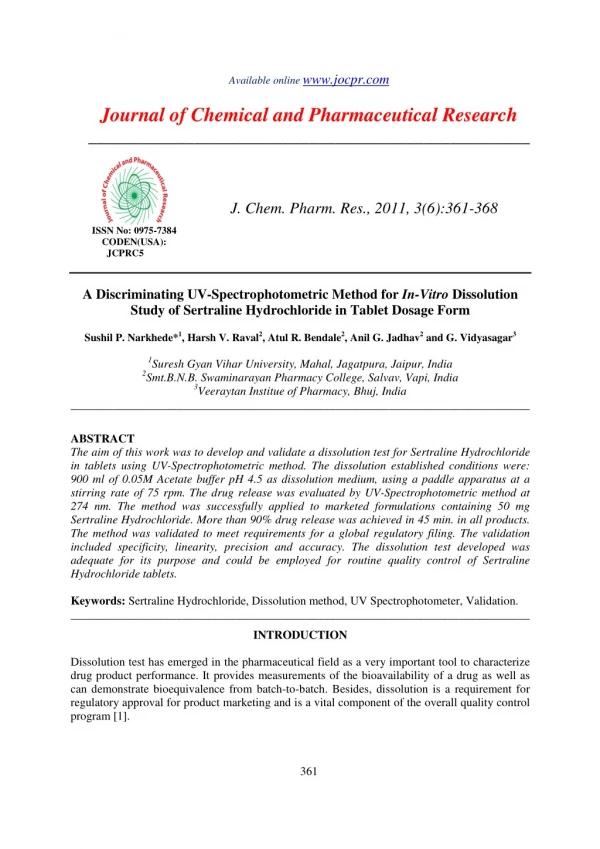
The aim of this work was to develop and validate a dissolution test for Sertraline Hydrochloride<br>in tablets using UV-Spectrophotometric method. The dissolution established conditions were:<br>900 ml of 0.05M Acetate buffer pH 4.5 as dissolution medium, using a paddle apparatus at a<br>stirring rate of 75 rpm. The drug release was evaluated by UV-Spectrophotometric method at<br>274 nm. The method was successfully applied to marketed formulations containing 50 mg<br>Sertraline Hydrochloride. More than 90% drug release was achieved in 45 min. in all products.<br>The method was validated to meet requirements for a global regulatory filing. The validation<br>included specificity, linearity, precision and accuracy. The dissolution test developed was<br>adequate for its purpose and could be employed for routine quality control of Sertraline Hydrochloride tablets. <br>

E N D
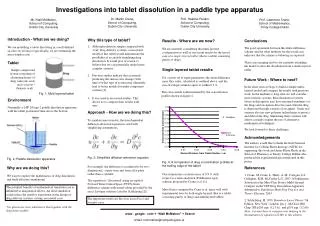
Available online www.jocpr.com Journal of Chemical and Pharmaceutical Research __________________________________________________ J. Chem. Pharm. Res., 2011, 3(6):361-368 ISSN No: 0975-7384 CODEN(USA): JCPRC5 A Discriminating UV-Spectrophotometric Method for In-Vitro Dissolution Study of Sertraline Hydrochloride in Tablet Dosage Form Sushil P. Narkhede*1, Harsh V. Raval2, Atul R. Bendale2, Anil G. Jadhav2 and G. Vidyasagar3 1Suresh Gyan Vihar University, Mahal, Jagatpura, Jaipur, India 2Smt.B.N.B. Swaminarayan Pharmacy College, Salvav, Vapi, India 3Veeraytan Institue of Pharmacy, Bhuj, India ______________________________________________________________________________ ABSTRACT The aim of this work was to develop and validate a dissolution test for Sertraline Hydrochloride in tablets using UV-Spectrophotometric method. The dissolution established conditions were: 900 ml of 0.05M Acetate buffer pH 4.5 as dissolution medium, using a paddle apparatus at a stirring rate of 75 rpm. The drug release was evaluated by UV-Spectrophotometric method at 274 nm. The method was successfully applied to marketed formulations containing 50 mg Sertraline Hydrochloride. More than 90% drug release was achieved in 45 min. in all products. The method was validated to meet requirements for a global regulatory filing. The validation included specificity, linearity, precision and accuracy. The dissolution test developed was adequate for its purpose and could be employed for routine quality control of Sertraline Hydrochloride tablets. Keywords: Sertraline Hydrochloride, Dissolution method, UV Spectrophotometer, Validation. ______________________________________________________________________________ INTRODUCTION Dissolution test has emerged in the pharmaceutical field as a very important tool to characterize drug product performance. It provides measurements of the bioavailability of a drug as well as can demonstrate bioequivalence from batch-to-batch. Besides, dissolution is a requirement for regulatory approval for product marketing and is a vital component of the overall quality control program [1]. 361
Sushil P. Narkhede et al ______________________________________________________________________________ J. Chem. Pharm. Res., 2011, 3(6):361-368 Sertraline tetrahydronaphthalen-1-amine hydrochloride (Fig. 1) is white or almost white powder, slightly soluble in water, freely soluble in anhydrous ethanol, slightly soluble in acetone and in isopropanol. SER is primarily selective serotonin reuptake inhibitor (SSRI), belongs to the category of antidepressant drug. It is official in British pharmacopoeia [2]. SER is available in market in tablet dosage form. Extensive literature survey shows that no instrumental method is reported for estimation of percent release of SER from tablet. Hence an attempt has been made to develop an ideal dissolution method for determination of percent release of drug from their dosage form. The proposed method is simple, specific, accurate, precise, reproducible and suitable for routine quality control analysis of Sertraline HCl tablets [3- 11]. Hydrochloride (SER), (1S,4S)-4-(3,4-dichlorophenyl)-N-methyl-1,2,3,4- Figure 1: Structure of Sertraline Hydrochloride (SER) EXPERIMENTAL SECTION The drug Sertraline HCl (SER) was obtained as a gift sample from Matrix Laboratories Ltd., Nashik (MS, India). Methanol, sodium acetate and glacial acetic acid of analytical grade were purchased from Priya Scientific Pvt. Ltd., Vapi. The Double Beam UV spectrophotometer was of LABINDIA, Model: 3000+. The Dissolution Apparatus (Type II) was of ELECTROLAB, Model: TDT 06P. In addition an electronic balance (CONTECH), Digital pH meter (AE-MAX), Ultrasonicator (CITIZEN), Hot air oven (LABLINE) was used in this study. All the glass apparatus used in this study was of J-SIL. Preparation of Stock Solution and Dissolution Medium: Dissolution medium was prepared by dissolving 4.1 gm sodium acetate (anhydrous) in1000 ml distilled water and pH 4.5 was adjusted with glacial acetic acid. Stock solution was prepared by weighing 25 mg of SER. Transfer the weighed drug to 25 ml volumetric flask and make up the volume up to the mark with methanol to obtain solution containing 1000 µg/ml of SER. The solution was further diluted with dissolution medium to obtain final concentration of 20-120 µg/ml of SER. 362
Sushil P. Narkhede et al ______________________________________________________________________________ J. Chem. Pharm. Res., 2011, 3(6):361-368 Selection of Sampling Wavelength: Solutions containing of SER (100 µg/ml) was scanned from 200 nm to 400 nm and spectra were recorded. The wavelength of maximum absorption (λmax) was observed at 274 nm and selected for estimation. It is shown in Fig. 2 Figure 2: UV-Spectra of Sertraline Hydrochloride in 0.05M Acetate buffer pH 4.5 Calibration Curve for SER: Suitable aliquots of SER stock solution were taken in different 10 ml volumetric flask and diluted up to the mark with dissolution medium to obtain final concentration of 20-120 µg/ml of SER. The absorbance of the solutions was measured at 274 nm. Calibration curve were constructed by plotting Absorbance versus Concentration as shown in Fig 3. The results are reported in Table 1. 0.9 A b s o r b a n c e 0.8 y = 0.006x + 0.008 R² = 0.9998 0.7 0.6 0.5 0.4 0.3 0.2 0.1 0 0 20 40 60 80 100 120 140 Concentration (µg/mL) Figure 3: Calibration curve for SER 363
Sushil P. Narkhede et al ______________________________________________________________________________ J. Chem. Pharm. Res., 2011, 3(6):361-368 Table 1: Linearity data of SER by UV Spectroscopy Parameters Linear Range (µ µ µ µg/ml) 20-120 µg/ml Slope Intercept R2 value LOD LOQ SER 0.006 0.008 0.9998 0.34 µg/ml 1.04 µg/ml Analysis of Marketed Formulations: Take 10 ml dissolution medium filter it through MDI syringe filter and fill up the cuvettes and set zero. Prepare standard solution by dissolving 25 mg SER in 50 ml methanol volumetric flask. Dilute 1 ml of this solution to 10 ml with 0.05M Acetate buffer pH 4.5 in volumetric flask. Measure its absorbance at 274 nm. Set the dissolution apparatus with paddle (Type II) at rotation speed of 75 rpm and temperature 37°C ±0.5°C. Place one tablet containing 50 mg of SER in 900 ml dissolution medium and immediately run dissolution apparatus up to 45 min. Withdraw 5 ml aliquots at the interval of 5, 10, 15, 30, 45 min and filter through MDI syringe filter in test tube. Measure its absorbance. Replacement of the same volume of the medium at 37°C ±0.5°C was done for constant maintenance of the volume. Percent drug release was calculated by formula: % Drug release = Abs. of SPL/Abs. of STD * Wt. of STD/50 * 1/10 * Vol. of Disso Med/one tab * % Purity/100 * 100/Label Claim Method Validation [12-18]: The dissolution test was validated as per the recommendations of ICH and USP for the parameters like accuracy, linearity, precision, Specificity, detection limit, quantitation limit and ruggedness. The accuracy of the method was determined by calculating percentage recovery of SER. Recovery studies were carried by addition of standard solution containing 20 µg/ml of SER to the preanalyzed sample solution after 10, 15, 30 min. time interval. Absorbance of the solution was measured at 274 nm and percent recovery was calculated. Results are reported in Table 3. Variation of results within the same day (intra-day), variation of results between days (inter day) were analyzed. Intra-day precision was determined by analyzing VEN for three times in the same day. Inter-day precision was determined by analyzing VEN daily for three days. The limit of detection (LOD) and limit of quantitation (LOQ) were calculated using following formulae: LOD= 3.3(SD)/S and LOQ= 10 (SD)/S, where SD=standard deviation of response (absorbance) and S= average of the slope of the calibration curve. The standard deviation of the response can be determined based on the standard deviation of y-intercepts of regression lines. Ruggedness of the proposed method is determined by analysis of aliquots from homogenous slot by different analyst. RESULT AND DISCUSSION Drug solubility and solution stability are important properties to be considered when selecting the dissolution medium. SER stability in dissolution medium was evaluated at 37.0 ± 0.5ºC for 3 hours. No change in absorbance after 3 hours indicates the stability of SER. In this study, 0.05M 364
Sushil P. Narkhede et al ______________________________________________________________________________ J. Chem. Pharm. Res., 2011, 3(6):361-368 acetate buffer pH 4.5 is used as dissolution medium. An important aspect it simulates the environment in GI track which monitor biopharmaceutical characteristic of the drug product, 900 ml 0.05M acetate buffer pH4.5 provides sink condition for tablet containing 100 mg Sertraline Hydrochloride. USP Type II with Paddle rotating at 75 rpm was selected as a dissolution apparatus was selected for the dissolution study. UV-spectra of SER showed that the drug absorbed appreciably at 274 nm, so this wavelength was selected as the detection wavelength. The calibration curve for SER was found to be linear over the range of 20-120 µg/ml. The data of regression analysis of the calibration curves is shown in Table 1. The proposed method was successfully applied for the estimation of SER in their tablet dosage form (Table 2, Fig 4). Table 2: Analysis of Marketed Formulations By UV-Spectroscopy % Dissolution Product A Product B Product C 5 15.82 10 29.57 15 49.54 20 73.40 30 88.96 45 99.07 Time (Min) 13.68 24.92 56.74 72.19 88.21 94.12 16.17 30.64 49.35 72.89 87.53 97.71 100 90 80 70 60 50 % Drug Release Product A 40 Product B 30 Product C 20 10 0 0 5 10 15 20 25 30 35 40 45 Time (Min) Figure 4: Dissolution profile of SER in 0.05M Acetate buffer pH 4.5 at 75 rpm The accuracy expresses the agreement between the accepted value and the value found. The % Recovery was found between 99.90% – 100.01%, it proved that method is accurate (Table 3). 365
Sushil P. Narkhede et al ______________________________________________________________________________ J. Chem. Pharm. Res., 2011, 3(6):361-368 Table 3: Accuracy data of SER Amount of drug present in sample (µg) 17.66 30.50 55.83 Sr. No. Time (Min) Amount of Std. drug added (µg) Total amount of Drug (µg) Amount of drug found (µg) % Recovery 1 2 3 10 15 30 20 20 20 37.66 55.50 75.83 37.64 55.45 75.84 99.94 99.90 100.01 The precision of the dissolution tests was evaluated through variation in the result in same day (intraday) and variation of the result between days (inter day). These results can demonstrate the good precision of the method for dissolution test (Table 4, 5). Table 4: Intra-Day Precision data for SER Sr. No. (Min) (µg/ml) 1 10 17.66 ± 0.027 2 15 30.50 ± 0.044 3 30 55.83 ± 0.089 *Mean of six determinations Table 5: Inter-Day Precision data for SER Sr. No. (Min) (µg/ml) 1 10 17.68 ± 0.035 2 15 30.53 ± 0.021 3 30 53.84 ± 0.083 *Mean of six determinations Limit of detection (LOD) for SER was found to be 0.34 µg/ml and Limit of quantification (LOQ) for SER was found to be and 1.04 µg/ml Specificity was examined by analyzing a solution of a placebo, which consisted of all the excipients the might be present in tablets except the drug. The excipients were lactose, dibasic calcium phosphate, maize starch, sodium starch glycolate, croscarmellose sodium, talc and magnesium stearate. Their concentrations were determined based in Handbook of Pharmaceutical Excipients and calculated for a medium weight of content. The absorption spectrum of SER in dissolution medium shows an absorbance peak at 274 nm. At this wavelength, no interference from the placebo (Figure 5) was observed. Table 6: Ruggedness data Time (Min) Conc. ± SD 1 10 17.66 ± 0.027 2 15 30.50 ± 0.044 3 30 55.83 ± 0.089 *Mean of six determinations Time Conc.*± SD % CV 0.152 0.144 0.159 Time Conc.*± SD % CV 0.197 0.068 0.154 Analyst I* Analyst II* Conc. ± SD 17.68 ± 0.035 30.53 ± 0.021 53.84 ± 0.083 Sr. No. % CV % CV 0.152 0.144 0.159 0.197 0.068 0.154 366
Sushil P. Narkhede et al ______________________________________________________________________________ J. Chem. Pharm. Res., 2011, 3(6):361-368 Figure 5: Specificity study of SER: absorption spectrum of SER (A), Placebo (B) The result of Ruggedness evaluation was shown in Table 6. CONCLUSION The dissolution test developed and validated for SER tablets was considered satisfactory. The conditions that allowed the dissolution determination were 900 ml of 0.05M Acetate buffer pH 4.5 at 37.0 ± 0.5 ºC, paddle apparatus, 75 rpm stirring speed and filtration with quantitative filter. In these conditions, the SER stability was guarantee. The % drug delivery was higher than 90% in 45 minutes for all evaluated products. The Uv-spectrophotometric method was validated and showed to be specific, linear, precise and accurate. Hence, the dissolution test developed was adequate for its purpose and could be employed for routine quality control of Sertraline Hydrochloride tablets. Acknowledgement The authors would like to thank Matrix Laboratories Ltd., Nashik (MS, India) for supply of standard drug and BNBSPC, Vapi (GJ, India) for their support and SGVU, Jaipur (RJ, India). REFERENCES [1]J Dressman, J Kramer., Pharmaceutical dissolution Testing, Taylor & Francis Group, LLC, 2005. [2]British Pharmacopoeia, HMSO Publication: London; 2009, Vol.I and II, 5379. [3]AIH Adams; AM Bergold Journal of Pharmaceutical and Biomedical Analysis, 2001, 26, 505–508. [4]D Chen; S Jiang; Y Chen; Hu Y. Journal of Pharmaceutical and Biomedical Analysis, 2004, 34:1, 239-245. [5]DS Jain, M Sanyal, G Subbaiah, UC Pande, P Shrivastav. Journal of Chromatography B, 2005, 829:1-2, 69-74. 367
Sushil P. Narkhede et al ______________________________________________________________________________ J. Chem. Pharm. Res., 2011, 3(6):361-368 [6]Kim K. M, Jung B. H, Woo J. S, Paeng K. J, Chung B. C. Journal of Chromatography B: Analytical Technologies in the Biomedical and Life Sciences, 2002, 769:2, 333-339. [7]I Lories, LI Bebawy, N El-Kousy, JK Suddik, M Shokry. Journal of Pharmaceutical and Biomedical Analysis, 1999, 21, 133–142. [8]SE Lucangioli, LG Hermida, VP Tripodi, VG Rodriguez, EE Lopez, PD Rouge, CN Carducci. Journal of Chromatography A, 2000, 871, 207–215. [9]R Mandrioli, MA Saracino, S Ferrari, D Berardi, E Kenndler, MA Raggi. Journal of Chromatography B, 2006, 836:1-2, 116-119. [10]HL Wiener. Journal of Chromatography, 1990, 527, 467-472. [11]MX Zhou, JP Foley. Journal of Chromatography A, 2004, 1053, 13–23. [12]JM Green. In; A Practical Guide to Analytical Method Validation, Anal.Chem. News & Features, May 1, 1996, 305A/309A. [13]ICH / CPMP Guidelines Q2B, Validation of Analytical Procedures Methodology, 1996. [14]ICH/CPMP guidelines Q2A, Text on Validation of Analytical Procedures, 1994. [15]The United State Pharmacopoeia (USP 27), National Publishing Philadelphia, Asian Edn., 2004, 2622-2624. [16]US FDA, General Principles of Validation, Rockville, MD, Center for Drug Evaluation and Research (CDER), May 1987. [17]US FDA, Guidelines for Submitting Samples and Analytical Data for Method Validation,Rockville, MD, Center for Drugs and Biologics Department of Health and Human Services, Feb. 1987. [18]RC Rowe, PJ Sheskey, ME Quinn, Handbook of Pharmaceutical Excipients, 6th Ed, PhP pharmaceutical press USA, 2009. 368