Download
1 / 5
50 likes | 89 Vues
Rare earth products have an extensive use in the realm of cutting-edge technology and military engineering. China<br>keeps the largest proportion of rare earth reserve and production all over the world. Whereas, it fails in obtaining<br>the pricing power in spite of its monopolistic status in terms of rare earth volume and even has been prosecuted<br>several times for the reason of export price. Using related export data of China’s rare earth products in the U.S.A<br>market from Jan. 2000 to Dec. 2011, based on different number of hidden cells, this paper establishes several BP<br>natural network models aiming at forecast the export price. In addition, selecting five predicting error indices,<br>involving Mean Absolute Error, Mean Absolute Percent Error, Root Mean Squared Predict Error, Normalized Mean<br>Square Error and Mean Square Percentage Error, this paper compares the forecasting precision of established<br>models. The research indicates that the predicting error is turned out to be lowest and forecasting precision is<br>relatively higher when the number of hidden cells is five. Therefore, this model could be used to forecast the change<br>of export price accurately and to provide scientific basis for decision makers.

E N D
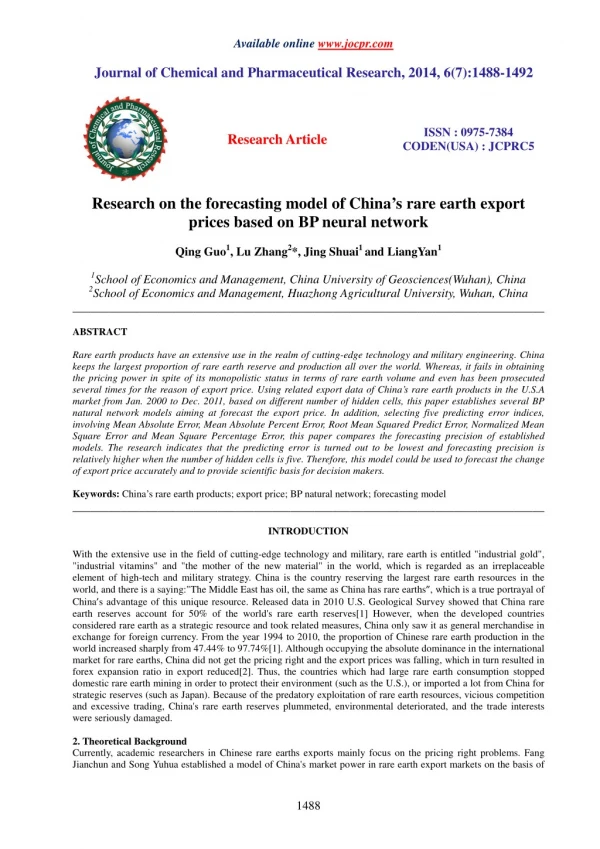
Available online www.jocpr.com Journal of Chemical and Pharmaceutical Research, 2014, 6(7):1488-1492 ISSN : 0975-7384 CODEN(USA) : JCPRC5 Research Article Research on the forecasting model of China’s rare earth export prices based on BP neural network Qing Guo1, Lu Zhang2*, Jing Shuai1 and LiangYan1 1School of Economics and Management, China University of Geosciences(Wuhan), China 2School of Economics and Management, Huazhong Agricultural University, Wuhan, China ______________________________________________________________________________ ABSTRACT Rare earth products have an extensive use in the realm of cutting-edge technology and military engineering. China keeps the largest proportion of rare earth reserve and production all over the world. Whereas, it fails in obtaining the pricing power in spite of its monopolistic status in terms of rare earth volume and even has been prosecuted several times for the reason of export price. Using related export data of China’s rare earth products in the U.S.A market from Jan. 2000 to Dec. 2011, based on different number of hidden cells, this paper establishes several BP natural network models aiming at forecast the export price. In addition, selecting five predicting error indices, involving Mean Absolute Error, Mean Absolute Percent Error, Root Mean Squared Predict Error, Normalized Mean Square Error and Mean Square Percentage Error, this paper compares the forecasting precision of established models. The research indicates that the predicting error is turned out to be lowest and forecasting precision is relatively higher when the number of hidden cells is five. Therefore, this model could be used to forecast the change of export price accurately and to provide scientific basis for decision makers. Keywords: China’s rare earth products; export price; BP natural network; forecasting model ______________________________________________________________________________ INTRODUCTION With the extensive use in the field of cutting-edge technology and military, rare earth is entitled "industrial gold", "industrial vitamins" and "the mother of the new material" in the world, which is regarded as an irreplaceable element of high-tech and military strategy. China is the country reserving the largest rare earth resources in the world, and there is a saying:"The Middle East has oil, the same as China has rare earths”, which is a true portrayal of China’s advantage of this unique resource. Released data in 2010 U.S. Geological Survey showed that China rare earth reserves account for 50% of the world's rare earth reserves[1] However, when the developed countries considered rare earth as a strategic resource and took related measures, China only saw it as general merchandise in exchange for foreign currency. From the year 1994 to 2010, the proportion of Chinese rare earth production in the world increased sharply from 47.44% to 97.74%[1]. Although occupying the absolute dominance in the international market for rare earths, China did not get the pricing right and the export prices was falling, which in turn resulted in forex expansion ratio in export reduced[2]. Thus, the countries which had large rare earth consumption stopped domestic rare earth mining in order to protect their environment (such as the U.S.), or imported a lot from China for strategic reserves (such as Japan). Because of the predatory exploitation of rare earth resources, vicious competition and excessive trading, China's rare earth reserves plummeted, environmental deteriorated, and the trade interests were seriously damaged. 2. Theoretical Background Currently, academic researchers in Chinese rare earths exports mainly focus on the pricing right problems. Fang Jianchun and Song Yuhua established a model of China's market power in rare earth export markets on the basis of 1488
Lu Zhang et al ______________________________________________________________________________ J. Chem. Pharm. Res., 2014, 6(7):1488-1492 Knetter model. It displayed that China only had restricted market power in Hong Kong, Indonesia and Thailand markets among all the 17 export markets[3]. Liao Zefang and Liu Kejia conducted Granger causality test on the relationship between the amount of Chinese rare earth trade and international market prices. The result showed that the relationship was not causal, but international market price influenced China's rare earth export[4]. Fukuda Kazunori and Hara Hisayuki did some researches on the relationships between Chinese export restrictions on rare earths and rare earth prices, which indicated that the price of rare earth metals showed a significant increasing trend shortly after China strengthened export restrictions. Meanwhile, when China repeated export restriction measures, the response time that price increasing phenomenon influencing restrictive measures was shortened [5].Deng Wei analyzed the current situation and urgency of China’s lack of rare earth pricing right. He pointed out that China should improve the industrial concentration, formulate a rare earth "cartel" system, and form a international pricing center, and establish a rare earth reserve system by drawing lessons from foreign successful cases[2]. Anna Vateva considers that the decision of reducing the rare earth export quota not only makes REE prices rise, but also reflects the industrial countries’ dependence on China (quasi-monopoly supplier of rare earths)[6]. To sum up, China's rare earth export problem is one of the focus in the international community and the academic researches on this issue is mainly focused on exploring the international status of China especially its pricing right. The researchers are mainly qualitative and only a few quantitative. Thus, this paper establishes many BP neural network models forecasting export prices by choosing the changing trend in export prices of Chinese rare earth research as background, using rare earth export data from China to the U.S. from January 2000 to December 2011, and considering the number of different hidden layer neurons; selects the mean absolute error, mean relative error, absolute root mean square error, regular MSE, and the mean square percentage error to evaluate the predictions of each model; finally find out a price forecasting model that can provide the basis for management. EXPERIMENTAL SECTION 3. Data and Method 3.1 Data constituting the data processing In this paper, the selected data, a set of 143 indicators, are the related properties’ indicators of U.S. market conditions where China's rare earth products are exported to and macroeconomic background. Specifically, the related properties’ indicators of China’s exported rare earth products are used from HS Code 2846 (rare earth metals, yttrium, scandium, and compounds of mixtures) and 85051110 (rare earth permanent magnets), covering the main export products of China's rare earth. The related properties’ indicators of macroeconomic background use the exchange rate, price index, gross national products and the producer price index to characterize different periods of macroeconomic situation’s impacts on exports. The time dimension is a set of 143 samples from January 2000 to December 2011 monthly data, in which the July 2009 data is missing. In the BP neural network training, it takes logarithmic of the related properties’ indicators of exports and macroeconomic situation, eliminates differences in dimension, and then takes a set of 100 samples from 143 in total to train the network, and takes the remaining 43 sets of data to test the predictive power of the network. 3.2 Prediction model and evaluation index This paper select the export volume, exchange rate, price index, GDP, the producer price index as the five indicators to forecast China's rare earth export price. Here the neural network includes 5 neurons in the input layer and 1 neuron in the output layer. The number of neurons in the hidden layer has a significant impact on the network learning ability. If the number is too small, the network can not sufficiently study the data, thus affecting the predicted result; and if the number is too large, the network structure may be complex which may lead to the problem of over-fitting. When determining the number of neurons in the hidden layer of the neural network structure, it needs to compromise between describing the nonlinear rules of time series and preventing the complex network [7], so that the model can satisfy the minimum of the prediction accuracy requirements. Based on the related properties’ indicators of U.S. market conditions where China's rare earth products are exported to and macroeconomic background, this paper trains the BP neural network prediction model in the context of different numbers of neurons in the hidden layer, outputs the predicted results and error parameters, and get the best predictive model by comparisons. (1)The selection of neurons number in the hidden layer. Although the neurons number of hidden layer is a key parameter of the BP neural network model, there is still no unified mathematical expression to calculate the optimal number of neurons in the hidden layer. According to the empirical comparisons in the study, some scholars put forward some valuable experience criteria. Masters gives a rough estimate: For a three-layer neural network, assuming that it has n input neurons and m output neurons, the number of hidden layer neurons 1489
Lu Zhang et al ______________________________________________________________________________ J. Chem. Pharm. Res., 2014, 6(7):1488-1492 n× n× m is .Sometimes, according to the actual problems, the number of hidden layer neurons is used in the range of m to m n× 2 and then compare the result in the following five evaluation criteria. (2)The evaluation criteria of BP neural network model prediction effect. Since the BP neural network cannot use common testing indicators of econometric techniques such as R-squared, confidence and significance etc, in most studies, researchers generally use error or some other related indicators to determine the predictive performance of the network. Assuming that N forecast periods, variables at time t.The average indicators of prediction error include: the average absolute error, mean relative error, absolute root mean square error, regular mean square error, and mean square percentage error (MSPE) (as shown in Table 1). Table 1 Commonly used average index to predict error The average prediction error ∑ = t N 1 R-Squared. ∑ = t t y N 1 percentage bias error whose value is defined within 0 to 100. n× n× 5 . 1 5 . 1 5 . 3 m m [9]. In this paper, the number of neurons were calculated from to , ty ˆ represent the actual data and model output results of ty and Computational formula Descriptions − y ˆ y 1 N t t = − Mean Error, MAE Absolute y ˆ MAE y Since each accuracy of MAE value, the smaller the value, the higher degree of is positive, it can accurately display prediction t t MAPE indicators can truly reflect the prediction accuracy which is a relatively good indicator for comparing the error size in different information conditions (if not the same number of samples). It can be interpreted as the − y ˆ y 1 N Mean Percent MAPE Absolute Error, = t t MAPE N 1 Root Squared Error, RMSE Mean Predict RMSE can better measure the nuances of different prediction models’ prediction error, because it amplifies the error which makes the minor changes more sensitive than the MAE. ( ) ∑ = t ∑ t N ∑ = t 1 2 = − y ˆ RMSE y t t N 1 1 N ( ) 2 = − y ˆ NMSE y t y the differences between the predicted data and actual data, which is the most widely used indicator to evaluate the effect in the neural network prediction model. t t σ 1 2 is the mean between data 1 ~ N. NMSE values is an important signal of Normalized Mean Square NMSE = 1 ( Error, N ) 2 σ = − y y Here, t t − N 1 2 − y ˆ y y N 1∑ N Mean Percentage Error, MSPE Square MSPE is a typical method for predicting the evaluation effect of outside samples in econometrics, and it is commonly used in comparison with the random walk model. = t t MSPE = 1 t t Source: the author finishes proceeds in accordance with the relevant information. Figure 1 predicting outcomes when 4 neurons 4. Neural network forecasting output and comparison This paper includes one output neuron (export price), 5 input neurons (export volume, exchange rate, price index, 1490
Lu Zhang et al ______________________________________________________________________________ J. Chem. Pharm. Res., 2014, 6(7):1488-1492 gross national product and the producer price index), the range of hidden layer neuron number is 3.35 ~ 7.83. Therefore, this paper trains the BP neural network forecasting model including 4,5,6,7 neurons in the hidden layer, and compares 4 predicting outcomes of 4 prediction models. 4predicting outcomes of the prediction models when the number of neurons are 4,5,6,7 are shown in Figure 1 to Figure 4. Figure 2 predicting outcomes when 5 neurons Figure 3 predicting outcomes when 6 neurons Figure 4 predicting outcomes when 7 neurons 1491
Lu Zhang et al ______________________________________________________________________________ J. Chem. Pharm. Res., 2014, 6(7):1488-1492 Obviously, comparing Figures 1 to 4, when the neurons number in the hidden layer of BP neural network model is 5, the predicting outcomes and the expected output is substantially coincident, which means superior prediction performance. The average value of the prediction error indicators when the neurons number in the hidden layer is 4,5,6,7 are shown in Table 2. Table 2 Prediction error with different neurons number in the hidden layer neurons number in the hidden layer MAE MAPE RMSE NMSE MSPE As is shown in Table 1, when neurons number in the hidden layer is 5, MAE(0.2292), RMSE(0.3858) and NMSE (0.1489) are the lowest; when neurons number in the hidden layer is 7, MAPE (0.1191) and MSPE (0.0236) are the lowest, however, the these 2 outcome are very close to MAPE (0.1256) and MSPE (0.0282) when neurons number in the hidden layer is 5.Therefore, as the error indicators all show lower values when the neurons number of hidden layer is 5, this paper argues that it can more accurately predict the export prices of China’s rare earth products in the U.S. market under this BP neural network scenario, which means that the network has superior prediction performance. RESULTS AND DISCUSSION This paper create multiple BP neural network model to forecast the export price using the data of China’s rare earth products exported to the U.S. market from January 2000 to December 2011 based different neurons numbers in the hidden layer, and uses MAE, MAPE, RMSE, NMSE and MSPE to evaluate the predictions of each model. According to the prediction figures and error indicator values outcomes, the error indicator values are relatively low when the neurons number in the hidden layer is 5, meaning that the BP neural network to predict has a higher prediction accuracy and better performance at this time. Therefore, the BP neural network model trained in this paper can more accurately predict the export price changes of rare earth products, thus providing a scientific basis for the decision makers. In the subsequent study, the sensitivity analysis and other related analysis on the export prices changes under different scenarios of export quotas will be studied based on the BP neural network model trained in this paper. Meanwhile, in addition to the United States, Japan is one of the major countries importing China’s rare earth products, export prices of China's rare earth products in the Japanese market can be predicted based on the conclusions made in this paper and related data trained by BP neural network model. Acknowledgements This research is supported by Chinese Ministry of Education- Key Project of Philosophy and Social Sciences Research: Research on China's Mineral Resources Strategies under Economic Globalization (No.12JZD034). REFERENCES [1]U.SGeological Survey. Mineral Commodity Summaries,2012,(5). [2]DENG Wei. International Economics and Trade Research, 2012,(1),33-34. [3] FANG Jian-chun;SONG Yuhua.Journal of International Trade, 2013, (1),3-11. [4]LIAO Ze-fang; LIU Ke-ja. International Business ,2012, (3),59-66. [5]FUKUDA Kazunori; HARA Hisayuk. Journal of MMIJ, 2012,(6),172-183. [6]ANNA Vateva. Japan and the USA. 2012,(5),64-67. [7]WHUTE H.Proceedings of the IEEE International Conference on Neural Networks.1988, 451-458. [8] RZEMPOLUCK E. J. Neural network data analysis using Stimulant, Pinter Publishers, London , 1988; 330-348. [9]MASTERS.Practicalneural networks recipes in C++[M].Academic Press, London,1993;325-328. 4 5 6 7 0.3795 0.2157 0.4791 0.2296 0.0705 0.2292 0.1256 0.3858 0.1489 0.0282 0.4503 0.2355 0.6128 0.3757 0.0936 0.2407 0.1191 0.3895 0.1518 0.0236 1492