Download
1 / 12
120 likes | 142 Vues
Two simple and rapid spectrophotometric methods were developed for the resolution and<br>analysis of the binary mixture of glyburide (GB) and metformin HCl (MF) in tablets. The<br>first method, zero-crossing first derivative spectrophotometry, depends on measuring the<br>first derivative values at 314.7 nm for GB and 228.6 nm for MF. The second method, ratio<br>first derivative spectrophotometry, depends on measuring the amplitudes of the first<br>derivative of the ratio spectra at 314.7 nm for GB and 238.0 nm for MF. The calibration<br>graphs were linear over the range of 10-125 µg/mL for GB and 2-18 µg/mL for MF. The<br>proposed methods were applied successfully to the assay of these drugs in commercial<br>tablets. The developed methods were able to solve the problem arising from the coformulation<br>of GB and MF in the ratio of 2.5:500, 5:500 or 2.5:400 (w/w), respectively in<br>addition to the increase of the specific absorbance of MF (the major component) over that of<br>GB (the minor component). The results were statistically compared with those obtained using a reference HPLC method and were found to be in good agreement.

E N D
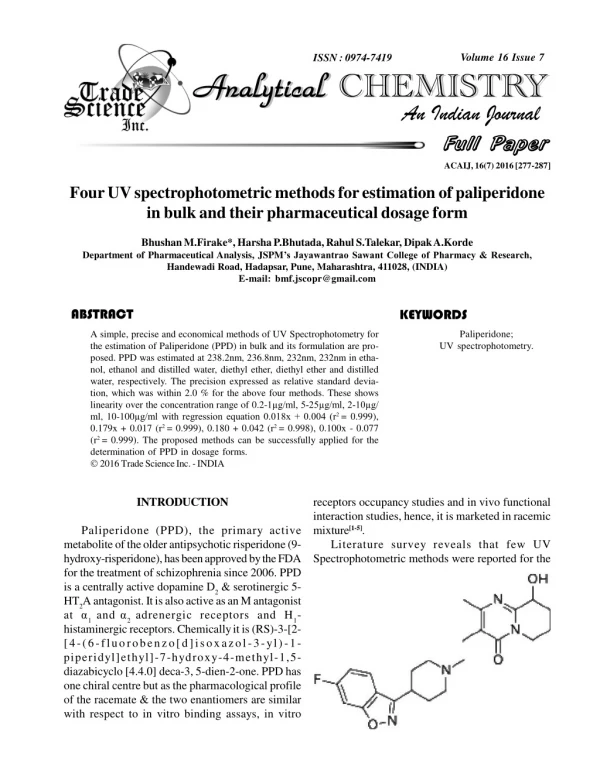
Available online at www.derpharmachemica.com Scholars Research Library Der Pharma Chemica, 2011, 3(1): 53-64 (http://derpharmachemica.com/archive.html) ISSN 0975-413X CODEN (USA): PCHHAX Spectrophotometric analysis of a mixture of glyburide and metformin HCl in pharmaceutical preparations Fathalla F. Belal1, Mohie K. Sharaf El-Din1, Fatma A. Aly1, Mohamed M. Hefnawy2, Mohamed I. El-Awady1* 1 Department of Analytical Chemistry, Faculty of Pharmacy, University of Mansoura, Mansoura, Egypt 2 Department of Pharmaceutical Chemistry, College of Pharmacy, King Saud University, P.O. Box 2457, Riyadh, Saudi Arabia ___________________________________________________________________________ ABSTRACT Two simple and rapid spectrophotometric methods were developed for the resolution and analysis of the binary mixture of glyburide (GB) and metformin HCl (MF) in tablets. The first method, zero-crossing first derivative spectrophotometry, depends on measuring the first derivative values at 314.7 nm for GB and 228.6 nm for MF. The second method, ratio first derivative spectrophotometry, depends on measuring the amplitudes of the first derivative of the ratio spectra at 314.7 nm for GB and 238.0 nm for MF. The calibration graphs were linear over the range of 10-125 µg/mL for GB and 2-18 µg/mL for MF. The proposed methods were applied successfully to the assay of these drugs in commercial tablets. The developed methods were able to solve the problem arising from the co- formulation of GB and MF in the ratio of 2.5:500, 5:500 or 2.5:400 (w/w), respectively in addition to the increase of the specific absorbance of MF (the major component) over that of GB (the minor component). The results were statistically compared with those obtained using a reference HPLC method and were found to be in good agreement. Keywords: Glyburide, Metformin HCl, First derivative spectrophotometry, Ratio derivative spectrophotometry, Pharmaceutical preparations. ___________________________________________________________________________ INTRODUCTION Glyburide (GB) is a sulfonylurea hypoglycemic while metformin hydrochloride (MF) is a biguanide hypoglycemic. Both drugs are given by mouth in the treatment of type 2 diabetes mellitus [1]. GB is available in combination with MF in tablets in 2.5:500, 5:500 or 2.5:400 ratios (w/w), respectively. Combination treatment with MF and sulfonylurea is more effective than these drugs alone in improving glycemic control in type 2 diabetes, while also allowing a reduction of the dosage of each drug [2]. 53 www.scholarsresearchlibrary.com
Mohamed I. El-Awadyet al Der Pharma Chemica, 2011, 3 (1):53-64 __________________________________________________________________________ In spite of the increasing use of this mixture in the treatment of type 2 diabetes mellitus, few methods have been described for its analysis. A review of the literature revealed that the methods published for the determination of this combination relied mainly on the use of chromatographic methods, such as HPLC [3-6], TLC [7] and liquid chromatography tandem mass spectrometry [8,9]. In addition, Capillary electrophoresis has been used for the determination of this combination together with phenformin [10]. A review of the analytical methods used for bioavailability studies of glyburide/metformin mixture in addition to other oral anti-diabetic drugs was published by Thirumurugu et al. [11]. Although these methods offer a high degree of specificity, the instrumentation limitations preclude their use in routine analysis. To the best of our knowledge, no spectrophotometric methods have been yet described for the determination of both drugs in tablets. Therefore, it was desirable to develop a simple and fast procedure that could be applied in quality control laboratories for the determination of both drugs in the presence of each other. Derivative spectrophotometry offers greater selectivity than normal spectrophotometry in the simultaneous determination of two or more drugs without previous chemical separation [12- 15]. Principles and advantages of this technique have been described by O’Haver and Green [16]. Ratio derivative spectrophotometry is based on the use of the first derivative of the ratio spectra. This method was developed by Salinas et al. [17]. Berzas Nevado et al. extended this method to resolving ternary mixtures [18]. The present paper describes simple and rapid methods for the determination of both GB and MF in synthetic mixtures and in commercial tablets by first derivative spectrophotometry and ratio first derivative spectrophotometry without prior separation of the two drugs. MATERIALS AND METHODS Experimental Apparatus Spectrophotometric analysis was carried out on a Shimadzu (Kyoto, Japan) UV-1601 PC, UV-Visible double-beam spectrophotometer with matched 1 cm path-length quartz cells. Suitable settings were: Slit width, 1 nm; scan speed, fast; sampling interval, auto. For first derivative spectra of both drugs: Wavelength range 200-350 nm, ∆λ = 4 nm and scaling factor = 10. For ratio derivative spectra of GB: Wavelength range 250-328 nm, ∆λ = 8 nm for smoothing of ratio spectra, ∆λ = 4 nm for the first derivative of ratio spectra and scaling factor = 1. For ratio derivative spectra of MF: Wavelength range 212-268 nm, ∆λ = 4 nm for smoothing of ratio spectra, ∆λ = 4 nm for the first derivative of ratio spectra and scaling factor = 1. Materials and reagents Pure drug samples were kindly provided by pharmaceutical companies: Glyburide (Pharco Pharmaceuticals, Alexandria, Egypt) and metformin hydrochloride (CID, Cairo, Egypt). Pharmaceutical preparations were purchased from commercial sources. Methanol analytical grade was obtained from Prolabo, France. Standard solutions Stock solutions (1 mg/mL) of GB and MF were prepared in methanol. These solutions were stable for at least 7 days when kept in the refrigerator. 54 www.scholarsresearchlibrary.com
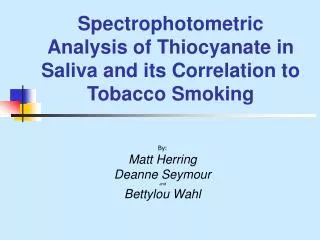
Mohamed I. El-Awadyet al Der Pharma Chemica, 2011, 3 (1):53-64 __________________________________________________________________________ Procedure for calibration curves Working standard solutions of GB and MF were prepared from the previous stock solutions by serial dilutions with methanol to 10-125 µg/mL for GB and 2-18 µg/mL for MF (final concentration). 1. for the determination by first derivative spectrophotometry. The first derivative spectra were recorded against methanol and the first derivative values were measured at 314.7 nm for GB and 228.6 nm for MF. 2. for the determination by ratio derivative spectrophotometry. The first derivative of the ratio spectra (the spectra of GB divided by the spectrum of a 18 µg/mL MF solution and the spectra of MF divided by the spectrum of a 1 µg/mL GB solution) were recorded. The amplitudes at 314.7 nm for GB and 238.0 nm for MF were measured. Procedure for analysis of tablets Twenty tablets were weighed and then powdered. Two accurately weighed amounts of the powder, one contains 20 mg GB and the other contains 20 mg MF, were transferred into two separate 100 mL volumetric flasks, and diluted to the mark with methanol. Flasks were sonicated for 30 min, filtered and then analyzed as described under Procedure for calibration curves. The concentration of each drug was determined using either the calibration curve or the corresponding regression equation. RESULTS AND DISCUSSION GB and MF are co-formulated in tablets in the ratio of 2.5:500, 5:500 or 2.5:400 (w/w), respectively. Moreover the specific absorbance of MF (the major component) is higher than the specific absorbance of GB (the minor component) [19]. This rendered analysis of such mixture by conventional spectrophotometry challenging. Therefore, we resorted to first derivative and ratio first derivative spectrophotometry in an attempt to analyze the mixture of the two drugs in their tablets. Fig. 1A shows the absorption spectra of GB and MF in methanol which overlap sufficiently to demonstrate the resolving power of the proposed methods. As it may be seen, GB could be directly determined in presence of MF by measuring the absorbance at 300 nm where MF does not absorb. However, in the presence of high concentration of MF, as that present in tablets, it was impossible to determine GB by direct spectrophotometry since MF shows a linear background absorption in the wavelength region of 290-320 nm. Moreover, MF could not be directly determined in the presence of GB by conventional UV spectrophotometry due to the marked overlap of their spectra. These problems have been solved satisfactorily by the proposed methods. ‘Zero-crossing’ first derivative spectrophotometry Fig. 1B shows the first derivative spectra of both drugs where sharp bands of large amplitudes of GB and MF were produced which could offer more specific determination of these drugs. The zero-crossing method is the most common procedure for conducting analytical calibration so GB was determined by measurement of its first derivative amplitude at the zero-crossing of MF at 314.7 nm (1D 314.7)a while MF was determined by measurement of its first derivative amplitude at the zero-crossing of GB at 228.6 nm (1D228.6). 55 www.scholarsresearchlibrary.com
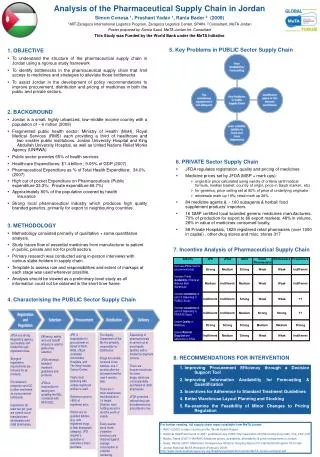
Mohamed I. El-Awadyet al Der Pharma Chemica, 2011, 3 (1):53-64 __________________________________________________________________________ 2.0 1.5 Absorbance 1.0 0.5 0.0 200 250 300 350 Wavelength (nm.) Fig. 1A. Zero-order spectra of 25 µg/mL GB (---) and 18 µg/mL MF (—) in methanol Fig. 1B. First derivative spectra of 25 µg/mL GB (---) and 18 µg/mL MF (—) in methanol. Ratio first derivative spectrophotometry Fig. 2A shows the ratio spectra of different concentrations of GB standards (spectra divided by the spectrum of a solution containing 18 µg/mL of MF) while Fig. 2B shows their first 56 www.scholarsresearchlibrary.com
Mohamed I. El-Awadyet al Der Pharma Chemica, 2011, 3 (1):53-64 __________________________________________________________________________ derivatives. As it can be seen, the amplitude at 314.7 nm (1DD314.7)a in the ratio derivative spectra corresponds to GB present in the solution, so it can be used for its quantitative determination. Likewise, Fig. 3A and Fig. 3B show the ratio spectra of different concentrations of MF standards (spectra divided by the spectrum of 1 µg/mL GB solution) as well as the corresponding first derivative spectra, on the basis of which MF can be quantified by measuring the amplitude at 238.0 nm (1DD238.0). The influence of ∆λ for obtaining the first derivative of the ratio spectra was tested to obtain the optimum wavelength interval; ∆λ = 4 nm was considered as suitable for both drugs. For selecting the standard solution as divisor, different concentrations were tested and different calibration curves were obtained. The best results in terms of signal– to– noise ratio, sensitivity and repeatability were obtained by using the spectra of 18 µg/mL MF and 1 µg/mL GB solutions as divisors in the determination of GB and MF, respectively. The results of the two proposed methods showed no significant differences with those obtained by the reference method [3] as regards to accuracy and precision. Fig. 2A. Ratio spectra of GB of (a) 10 µg/mL, (b) 25 µg/mL, (c) 50 µg/mL, (d) 75 µg/mL, (e) 100 µg/mL, and (f) 125 µg/mL; when 18 µg/mL MF is used as divisor. 57 www.scholarsresearchlibrary.com
Mohamed I. El-Awadyet al Der Pharma Chemica, 2011, 3 (1):53-64 __________________________________________________________________________ Fig. 2B. First derivative of the ratio spectra of GB of (a) 10 µg/mL, (b) 25 µg/mL, (c) 50 µg/mL, (d) 75 µg/mL, (e) 100 µg/mL, and (f) 125 µg/mL; when 18 µg/mL MF is used as divisor. Fig. 3A. Ratio spectra of MF of (a) 2 µg/mL, (b) 5 µg/mL, (c) 10 µg/mL, (d) 14 µg/mL, and (e) 18 µg/mL; when 1 µg/mL GB is used as divisor. 58 www.scholarsresearchlibrary.com
Mohamed I. El-Awadyet al Der Pharma Chemica, 2011, 3 (1):53-64 __________________________________________________________________________ Fig. 3B. First derivative of the ratio spectra of MF of (a) 2 µg/mL, (b) 5 µg/mL, (c) 10 µg/mL, (d) 14 µg/mL, and (e) 18 µg/mL; when 1 µg/mL GB is used as divisor. VALIDATION Linearity and range: The calibration graphs for the determination of GB and MF by the proposed methods were constructed by plotting the concentration versus the derivative amplitude. The graphs were found to be rectilinear over the concentration ranges cited in Table 1. Statistical analysis [20] of the data gave high values of correlation coefficients (r) of the regression equations, small values of the standard deviations of residuals (Sy/x), of intercept (Sa), and of slope (Sb), and small values of percentage relative standard deviation and percentage relative error (Table 1). These data proved the linearity of the calibration graphs and the conformity of the measurements of the proposed methods to Beer's law. Accuracy and precision: To prove the accuracy of the proposed methods, the results of the assay of GB and MF both in pure forms and in formulations were compared with those of the reference method [3]. Moreover, several synthetic mixtures of GB and MF in different ratios were also assayed. Statistical analysis of the results obtained by the proposed and reference methods using Student's t-test and variance ratio F-test showed no significant difference between them regarding accuracy and precision (Tables 2-4). The results obtained for both compounds were precise, as indicated by the small values of the relative standard deviation. 59 www.scholarsresearchlibrary.com
Mohamed I. El-Awadyet al Der Pharma Chemica, 2011, 3 (1):53-64 __________________________________________________________________________ Intraday and interday precisions were assessed using three concentrations and three replicates of each concentration. The relative standard deviations were found to be very small indicating reasonable repeatability and intermediate precision of the two proposed methods (Table 5). Specificity: The specificity of the methods was investigated by observing any interference encountered from common tablet excipients. It was shown that these compounds did not interfere with the proposed methods (Table 4). Limit of detection (LOD) and limit of quantitation (LOQ): LOD and LOQ were determined according to the United States Pharmacopoeia guidelines [21]. LOD was determined by establishing the minimum level at which the analyte can reliably be detected (signal-to-noise ratio is 3:1) while LOQ was determined by establishing the lowest concentration of analyte that can be determined with acceptable precision and accuracy (signal-to-noise ratio is 10:1) (Table 1). Ruggedness: To examine the ruggedness of the procedures, the intraday and interday precisions were evaluated as shown in Table 5. The precisions of the proposed methods were fairly high, as indicated by the low values of percentage relative standard deviation (% RSD) for both drugs. Dosage Forms Analysis The proposed methods were successfully applied to the assay of GB and MF in their tablets. The results obtained were in good agreement with those obtained with the reference method [3] (Table 4). Table 1. Analytical performance data of the calibration graphs for the determination of glyburide and metformin HCl by the proposed methods Glyburide Metformin HCl Ratio derivative method 10-125 0.069 0.481 0.9999 2.697 x 10⁻¹ 2.068 x 10⁻¹ 2.729 x 10⁻³ 0.612 0.250 1.800 6.000 4810 237614 Ratio derivative method 2-18 0.022 0.172 0.9999 8.224 x 10⁻³ 6.535 x 10⁻³ 6.116 x 10⁻⁴ 0.380 0.155 0.150 0.500 1720 28483 Parameters First derivative method First derivative method Linearity range (µg/mL) Intercept (a) Slope (b) Correlation coefficient (r) S.D. of residuals (Sy/x) S.D. of intercept (Sa) S.D. of slope (Sb) % RSD a % Error LOD (µg/mL)c LOQ (µg/mL)d A1% (dL.g-1.cm-1)e ε (L.mol-1.cm-1)f a Percentage relative standard deviation for six replicate samples.; b Percentage relative error for six replicate samples.; c Limit of detection.; d Limit of quantitation.; e Specific absorbance of the studied mode. f Molar absorptivity of the studied mode. 10-125 0.003 0.004 0.9999 2.102 x 10⁻³ 1.612 x 10⁻³ 2.126 x 10⁻⁵ 0.857 0.350 2.100 7.000 40 1976 2-18 0.007 0.035 0.9999 2.771 x 10⁻³ 2.201 x 10⁻³ 2.060 x 10⁻⁴ 0.823 0.336 0.250 0.800 350 5796 b 60 www.scholarsresearchlibrary.com
Mohamed I. El-Awadyet al Der Pharma Chemica, 2011, 3 (1):53-64 __________________________________________________________________________ Table 2. Assay results for the determination of glyburide and metformin HCl in pure forms % Recovery a Ratio derivative method 99.670 100.416 99.276 100.221 100.931 99.606 100.020 ± 0.612 0.24 (2.36) 2.624 (19.30) 99.700 100.460 99.900 100.060 99.379 100.194 99.949 ± 0.380 0.28 (2.36) 3.798 (5.786) Analyte First derivative method 100.000 99.000 100.500 101.667 100.250 100.200 100.270 ± 0.860 0.59 (2.36)b 1.331 (5.786) 98.550 100.000 99.517 100.570 100.814 99.522 99.829 ± 0.822 0.39 (2.36) 1.23 (19.30) a The average of three determinations. b The figures between parentheses are the tabulated values of t and F at P = 0.05. Table 3. Assay results for the determination of glyburide and metformin HCl in synthetic mixtures Reference method [3] 99.026 100.974 99.675 99.892 ± 0.992 100.670 99.230 100.253 100.081 ± 0.779 Glyburide Mean ± S.D. t F Metformin HCl Mean ± S.D. t F % Recovery a Ratio derivative method 99.925 101.192 99.905 101.328 101.571 99.309 100.538 ± 0.939 1.54 (2.36) 1.89 (19.30) 100.162 101.348 100.233 100.546 99.407 99.524 100.203 ± 0.711 0.17 (2.36) 2.22 (19.30) Analyte First derivative method 99.701 99.709 100.445 99.425 100.020 99.270 99.762 ± 0.423 0.48 (2.36)b 2.598 (5.786) 100.362 100.000 99.708 100.860 98.365 100.005 99.883 ± 0.842 0.75 (2.36) 3.11 (19.30) a The average of three determinations. b The figures between parentheses are the tabulated values of t and F at P = 0.05. Reference method [3] 98.906 100.270 99.584 99.587 ± 0.682 100.765 99.810 100.275 100.283 ± 0.478 Glyburide Mean ± S.D. t F Metformin HCl Mean ± S.D. t F 61 www.scholarsresearchlibrary.com
Mohamed I. El-Awadyet al Der Pharma Chemica, 2011, 3 (1):53-64 __________________________________________________________________________ Table 4. Assay results for the determination of glyburide and metformin HCl in commercial tablets % Recovery a Glyburide Ratio derivative method 101.215 101.191 100.074 100.827 ± 0.652 0.669 1.57 99.814 99.425 100.451 99.897 ± 0.518 0.565 6.52 100.402 98.458 100.730 99.863 ± 1.228 2.284 3.80 Metformin HCl Ratio derivative method 101.763 101.960 101.537 101.753 ± 0.212 2.132 3.62 98.125 98.870 99.555 98.850 ± 0.715 1.009 3.34 98.658 100.295 98.667 99.207 ± 0.943 0.940 2.12 Sample First derivative method 101.145 100.010 99.855 100.337 ± 0.704 0.139 1.34 99.145 99.810 99.985 99.647 ± 0.443 0.265 8.91 100.000 98.834 101.446 100.093 ± 1.308 1.896 4.31 Reference method [3] 100.971 100.813 99.486 100.423 ± 0.816 100.915 98.372 99.013 99.433 ± 1.323 101.435 101.215 102.400 101.683 ± 0.630 Reference method [3] 100.992 100.931 101.657 101.193 ± 0.403 101.016 99.737 98.401 99.718 ± 1.308 99.050 99.621 101.659 100.110 ± 1.372 First derivative method 101.654 101.846 100.560 101.353 ± 0.694 0.345 2.97 100.000 99.328 98.862 99.397 ± 0.572 0.390 5.22 101.145 100.015 100.600 100.587 ± 0.565 0.557 5.89 Glucovance® 500/5 tabletsb Mean ± S.D. t F Glucovance® 500/2.5 tabletsc Mean ± S.D. t F Glimet® tabletsd Mean ± S.D. t F a The average of three determinations. b Labeled to contain 500 mg MF and 5 mg GB; manufactured by Merck Santé, France, batch number 4038A. c Labeled to contain 500 mg MF and 2.5 mg GB; manufactured by Merck Santé, France, batch number 4037A. d Labeled to contain 400 mg MF and 2.5 mg GB; manufactured by Chemipharm Pharmaceuticals Industries, Egypt for Marcyrl Co., batch number 040042. N.B. Tabulated t-value at P = 0.05 is 2.78, tabulated F-value at P = 0.05 is 19.00 62 www.scholarsresearchlibrary.com
Mohamed I. El-Awadyet al Der Pharma Chemica, 2011, 3 (1):53-64 __________________________________________________________________________ Table 5. Accuracy and precision data for the determination of glyburide and metformin HCl by the proposed methods Glyburide Concentration (µg/mL) First derivative method Ratio derivative method 25 50 100 25 50 99.856 99.572 99.857 100.960 99.844 99.267 99.428 99.572 99.143 101.560 100.092 99.298 99.285 99.858 99.286 101.004 100.100 99.456 99.523 99.667 99.429 101.175 100.012 99.340 0.297 0.165 0.378 0.334 0.146 0.299 0.166 0.380 0.331 0.146 0.094 0.052 0.120 0.105 0.046 99.856 99.572 99.857 100.960 99.844 99.267 100.000 99.078 100.286 101.324 99.126 100.224 99.580 99.858 99.429 101.880 99.738 99.844 99.812 99.503 99.857 101.388 99.569 99.778 0.213 0.395 0.429 0.463 0.388 0.214 0.397 0.429 0.457 0.389 0.068 0.125 0.136 0.145 0.123 N.B. Each result is the average of three separate determinations Metformin HCl Concentration (µg/mL) First derivative method 5 10 14 100.540 99.380 100.750 99.460 99.920 99.657 100.080 99.190 99.657 100.027 99.497 100.021 0.542 0.379 0.631 0.542 0.381 0.631 0.171 0.120 0.200 100.741 99.380 100.750 101.082 99.920 99.657 99.620 99.920 99.551 100.481 99.740 99.986 0.765 0.312 0.664 0.761 0.313 0.664 0.241 0.099 0.210 Parameters Ratio derivative method 5 10 99.300 100.640 99.420 100.290 100.640 100.990 99.787 100.640 0.741 0.350 0.743 0.348 0.235 0.110 99.300 100.640 99.420 100.180 100.580 101.400 99.767 100.740 0.707 0.616 0.709 0.612 0.224 0.193 100 14 % Recovery 99.621 99.664 99.836 99.707 0.114 0.114 0.036 99.621 99.603 99.000 99.408 0.353 0.356 0.112 Intraday Mean ± S.D. % RSD % Error % Recovery 0.101 0.102 0.032 Interday Mean ± S.D. % RSD % Error 0.482 0.483 0.153 63 www.scholarsresearchlibrary.com
Mohamed I. El-Awadyet al Der Pharma Chemica, 2011, 3 (1):53-64 __________________________________________________________________________ CONCLUSION The two developed methods can be used for the determination of GB and MF in their binary mixture in pharmaceutical formulations. The zero-crossing derivative spectrophotometry is more rapid and simple than ratio derivative spectrophotometry; however the ratio derivative spectrophotometry has greater sensitivity and accuracy. These proposed methods could be regarded as useful alternative to the reported chromatographic and electrophoretic techniques in the routine quality control of pharmaceutical formulations, allowing qualitative and quantitative information to be simultaneously and rapidly achieved with a relatively inexpensive instrumentation. REFERENCES [1] S. Sweetman; Martindale (The Complete Drug Reference), The Pharmaceutical Press, London, 2007, Electronic version. [2] F. Tosi, M. Muggeo, E. Burn, G. Spiazzi, L. Perobelli, E. Zanolin, M. Gori, A. Coppini, P. Moghetti, Metabolism,2003,52, 862. [3] D.H. Khanolkar, V.M. Shinde, Indian Drugs,1999,36, 739. [4] J.F. Guo, X.Y. Chen, D.F. Zhong, Fenxi Cehsi Xuebao,2000,19, 5. [5] R. Jiang, J. Li, T. Zhang, C. Zhao, Z. He, Shenyang Yaoke Daxue Xuebao,2003,20, 272. [6] S. AbuRuz, J. Millership, J. McElnay, J. Chromatogr. B,2005,817, 277. [7] A. Gumieniczek, H. Hopkala, A. Berecka, D. Kowalczuk, J. Planar Chromatography- Modern TLC,2003,16, 271. [8] C.A. Mueller, W. Weinmann, S. Dresen, A. Schreiber, M. Gergov, Rapid Communications in Mass Spectrometry,2005,19, 1332. [9] C. Georgita, F. Albu, V. David, A. Medvedovici, J. Chromatogr. B,2007,854, 211. [10] E. Lai, S. Feng, J. Chromatogr. B,2006,843, 94. [11] S. Thirumurugu, V. Parthasarathy,D. Arumainayagam, R. Manavalan, Der Pharmacia Lettre, 2010, 2, 498. [12] M. Sali, A. Barhate, V. Patil, A. Bhadoriya, V. Choudhari, B. Kuchekar, Der.Pharma Chemica, 2010, 2, 12. [13] S. Srikakolapu, I. Khan, S. Gotteti, M. Jangala, T. Kolla, K. Gondala, Archives of Applied Science Research, 2010, 2, 23. [14] A. Karunakaran, K. Kamarajan, V. Thangarasu, Der Pharmacia Lettre, 2010, 2, 221. [15] S. Acharjya, P. Panda, P. Mallick, M. Annapurna, Der Pharmacia Lettre, 2010, 2, 452. [16] T.C. O’Haver, G.L. Green, Anal. Chem.,1976,48, 312. [17] F. Salinas, J.J. Berzas Nevado, A. Espinosa Mansilla, Talanta,1990,37, 347. [18] J.J. Berzas Nevado, C. Guiberteau Cabanillas, F. Salinas, Talanta,1992,39, 547. [19] Clarke's Analysis of Drugs and Poisons, The Pharmaceutical Press, London, 2006, Electronic version. [20] J.N. Miller, J.C. Miller; Statistics and Chemometrics for Analytical Chemistry,Pearson Education Limited, Harlow, England, 2005, 5th ed., 107-149. [21] United States Pharmacopoeia 28, the National Formulary 23, US Pharmacopeial Convention, 2005, Electronic version. 64