Download
1 / 5
50 likes | 81 Vues
A study was carried out to determine the concentration of heavy metal ions in and around this area. The present<br>study has been attempt to analyze the status of heavy metal concentration on the bank of Cooum River at Chennai<br>city. This study indicates that both urbanization and Industrialization have contributed to the large scale of<br>pollutions currently observed. The result shows that most of the groundwater is deteriorated more than the<br>permissible limit of WHO.

E N D
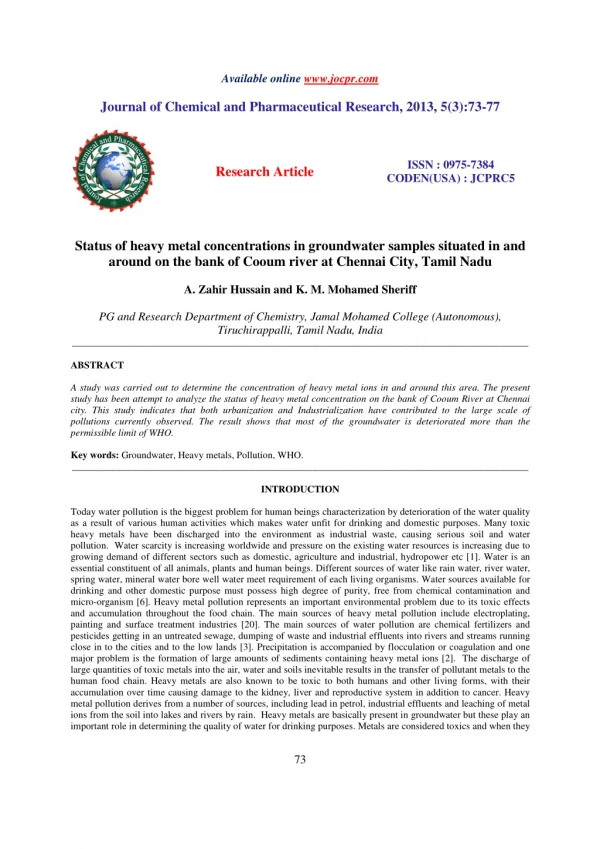
Available online www.jocpr.com Journal of Chemical and Pharmaceutical Research, 2013, 5(3):73-77 ISSN : 0975-7384 CODEN(USA) : JCPRC5 Research Article Status of heavy metal concentrations in groundwater samples situated in and around on the bank of Cooum river at Chennai City, Tamil Nadu A. Zahir Hussain and K. M. Mohamed Sheriff PG and Research Department of Chemistry, Jamal Mohamed College (Autonomous), Tiruchirappalli, Tamil Nadu, India _____________________________________________________________________________________________ ABSTRACT A study was carried out to determine the concentration of heavy metal ions in and around this area. The present study has been attempt to analyze the status of heavy metal concentration on the bank of Cooum River at Chennai city. This study indicates that both urbanization and Industrialization have contributed to the large scale of pollutions currently observed. The result shows that most of the groundwater is deteriorated more than the permissible limit of WHO. Key words: Groundwater, Heavy metals, Pollution, WHO. _____________________________________________________________________________________________ INTRODUCTION Today water pollution is the biggest problem for human beings characterization by deterioration of the water quality as a result of various human activities which makes water unfit for drinking and domestic purposes. Many toxic heavy metals have been discharged into the environment as industrial waste, causing serious soil and water pollution. Water scarcity is increasing worldwide and pressure on the existing water resources is increasing due to growing demand of different sectors such as domestic, agriculture and industrial, hydropower etc [1]. Water is an essential constituent of all animals, plants and human beings. Different sources of water like rain water, river water, spring water, mineral water bore well water meet requirement of each living organisms. Water sources available for drinking and other domestic purpose must possess high degree of purity, free from chemical contamination and micro-organism [6]. Heavy metal pollution represents an important environmental problem due to its toxic effects and accumulation throughout the food chain. The main sources of heavy metal pollution include electroplating, painting and surface treatment industries [20]. The main sources of water pollution are chemical fertilizers and pesticides getting in an untreated sewage, dumping of waste and industrial effluents into rivers and streams running close in to the cities and to the low lands [3]. Precipitation is accompanied by flocculation or coagulation and one major problem is the formation of large amounts of sediments containing heavy metal ions [2]. The discharge of large quantities of toxic metals into the air, water and soils inevitable results in the transfer of pollutant metals to the human food chain. Heavy metals are also known to be toxic to both humans and other living forms, with their accumulation over time causing damage to the kidney, liver and reproductive system in addition to cancer. Heavy metal pollution derives from a number of sources, including lead in petrol, industrial effluents and leaching of metal ions from the soil into lakes and rivers by rain. Heavy metals are basically present in groundwater but these play an important role in determining the quality of water for drinking purposes. Metals are considered toxics and when they 73
A. Zahir Hussain and K. M. Mohamed Sheriff J. Chem. Pharm. Res., 2013, 5(3):73-77 ______________________________________________________________________________ enter the body more than the prescribed limit they start causing harm. In the same way many physicochemical parameters play an important role in determining the quality of water [19]. Cooum River, the urban river of Chennai, starts from ‘Coovum’ or ‘Koovam’ 70 kms from the city in Thiruvallur district adjoining Chennai district. The length of the river is around 65kms and flows in three corporation zones of Nungambakkam, Triplicane, and Kilpauk which covers about 16 kms. The River Cooum, once a fresh water source is today a drainage course collecting surpluses of 75 small tanks of a minor basin. Hence, the present study has been undertaken to investigate the Heavy metals analysis on the bank of Cooum River at Chennai. EXPERIMENTAL SECTION Sampling Stations: The place of study at which water samples were collected is referred to as “Stations”. The study pertains to the quality of Cooum River and its impact on the groundwater. Experiments were carried out for the water collected in the pre monsoon season. Eight sampling stations were selected. They are represented as Mogappair East (S1), Naduvankarai (S2), Arumbakkam (S3), Aminjikarai(S4), Chetpet (S5), Egmore (S6), Chintadripet (S7), Triplicane (Anna Square)(S8). The groundwater samples were taken from the bore wells on either side of the bank of Cooum River [1A-8A, 1B-8B] of each station. The location of the study area map on the sampling stations is shown in the figure (1). The samples were collected in plastic cans. Prior to use, cans were cleaned thoroughly and rinsed with distilled water. They were dried, cooled and labeled. All necessary precautions were taken during sampling analysis and transportations of water samples to the laboratory [9, 10]. The samples were subjected to concentration of metal ions using standard procedure [11] using atomic absorption spectrometer (Perkin Elmer, model 2380). The instrument was used in the limit of précised accuracy. 74
A. Zahir Hussain and K. M. Mohamed Sheriff J. Chem. Pharm. Res., 2013, 5(3):73-77 ______________________________________________________________________________ A short-term field survey was conducted in the study area. The survey also sought to ascertain the water quality problems, major activities and sources of pollution. All reagents used were of analytical grade and equipment pre- calibrated appropriately with standard solutions prior to measurement. Replicate analyses were carried out for each determination to ascertain reproducibility and quality assurance. RESULTS AND DISCUSSION The obtained results of heavy metals are tabulated in Table 1. The results are discussed and compared with standard values. pH pH value is an important factor in maintaining the carbonate and bicarbonate levels in water. The pH values are recorded are within the range of 7.5-7.9 for groundwater samples (Table 1). The pH values are found to within the permissible limit of 6.5-8.5ppm [4] in all the sampling stations for groundwater samples. There are no abnormal changes in groundwater samples. The slight alkalinity may be due to the presence of bicarbonate ions, which are produced by the free combination of CO2 with water to form carbonic acid, which affects the pH of the water [11]. Carbonic acid (H2CO3) dissociates partly to produce (H+) and bicarbonate ions [12]. The pH values increase slightly for groundwater samples in some of the stations. The mild alkalinity indicates the presence of weak basic salts in the soil. The low pH does not cause any harmful effect [13]. Electrical conductivity(EC) The importance of electrical conductivity (EC) is its measure of salinity, which greatly affects the taste and has significant impact of the user acceptance of the water as potable [15]. The higher the ionisable solids, the greater will be the EC [16]. The EC values are recorded within the range of 740-3276 µmho cm-1 for the groundwater samples. The EC values are well above the permissible limit of 600 µmho cm-1 for groundwater samples. The groundwater samples which are very near to the river have maximum EC values. Percolation of channel water containing high ionisable salts and intrusion of domestic sewage enhance the EC level [14]. High EC values encountered at station 3B may be due to the higher rate of pollution of groundwater by flushing and leaching action of drainage water, which transfers the surface contamination. Chromium (Cr) The values of chromium in the groundwater sample are recorded within the range of 0.12-0.26 ppm for groundwater samples (Table 1). All the values are higher than the permissible limit of 0.05 ppm [4]. High content of Chromium may be due to various anthropogenic activities, industrial effluents, tanneries, old plumbing and household sewages [18]. Zinc (Zn) The values of Zinc are found to be in the range of 0.88-4.11ppm for groundwater samples. (Table 1) All the values are below the permissible limit of 5ppm [4]. This shows that Zinc toxicity is absent in the study area. However, source of slight high value (2A) may due to agricultural inputs, domestic waste discharges and the industrial effluents [5]. The presence of zinc in alluvial soil is also responsible for concentration in groundwater. Zinc occurs at concentration of approximately 205 mg/kg in dry solids of faeces. This shows that insanitary and unhygienic practices may also add to the zinc level. The low concentration of zinc (4A) in drinking water could be due to the fact that pH of water samples was slightly alkaline and its solubility is a function of decreasing pH. Hence all the samples collected from all the sources are below from maximum permissible limit of WHO. Manganese (Mn) The values of Manganese are recorded between the range of 0.01-0.08 ppm (Table 1). All the values are below the permissible limit of 0.5ppm [4]. But according to ISI for drinking water, permissible limit for manganese is 0.3ppm. In this study, the groundwater is not much polluted by manganese. However, slight rise in its level may be accounted for by the influence of domestic waste, natural geological rocks [17]. Copper (Cu) In the present study the values of Copper are recorded between 0.52-0.68 ppm for groundwater samples (Table 1). The values are within the permissible limit of 1ppm [4]. Higher copper content at few stations of 2A, 4A 6A, &7A reveals greater impact of pollution due to the seepage of domestic sewage. The average value of copper in all water 75
A. Zahir Hussain and K. M. Mohamed Sheriff J. Chem. Pharm. Res., 2013, 5(3):73-77 ______________________________________________________________________________ samples are much below the permissible limits. The low level may be due to absorption process by the soil, which reduces the concentration of the heavy metals in water [7]. High level of copper may be due to presence of industrial and domestic wastes [8]. The alkaline pH of the medium can also be the cause of low level of copper, as heavy metals are precipitated as their salts at high pH and are deposited as sediments. Lead (Pb) The values of lead are recorded between the ranges of 0.01-0.07ppm for groundwater samples. (Table 1). The maximum permissible concentration of lead in drinking water is 0.05ppm [4]. The high values are recorded in the stations 3A and 6A is more than the permissible limit. This may be due to the various anthropogenic activities. Lead contamination of the ground water may be the result of entry from industrial effluents, old plumbing, household sewages containing phosphate fertilizers and human and animal excreta [5]. The same result was inferred by [11]. Iron (Fe) The values of Iron in the range of 0.55-2.74 ppm for groundwater samples (Table 1). All the values are higher than the permissible limit of 1.0 ppm [4]. High amount of iron content was found in most of the samples. This may be due to the contributed by weathering of rocks and also by the discharge of effluent and other waste on surface that percolated into the groundwater. Higher amount encountered particularly at few stations show that they are having high domestic sewage [5]. The high Iron content can also be due to the presence of organic matter in deltaic sediments creating a reducing environment. Excess of Iron will also influence the presence of bacteria (iron - reducing) in groundwater. Nickel (Ni) The values of Nickel are recorded between the range of 0.08-0.27ppm for groundwater samples (Table 1). These values are higher than the permissible limit of 0.02ppm [4]. Nickel is also non-toxic element, but it affects physiological process at very high concentration. The high values are recorded in the station of 1B and 8B. The high level of nickel may due to mixing of variety of wastes including that of automobile repair shops, electroplating units, utensil manufacturing process, sewage, agricultural runoff [8]. Higher concentrations of these metals obtained in water extracts may be due to the presence of water soluble salts. High heavy metal concentration is attributed to run- off into the water body. Nickel concentrations in water at all the sites were higher than the upstream concentrations and the values exceeded the permissible limits. Nowadays people are using increasingly the Nickel-Cadmium batteries. Beyond this it may cause allergic reaction. Table 1. Concentrations of metal ions in groundwater samples. Station pH EC Cr Zn 1A 7.5 1,924 0.15 3.04 1B 7.8 1,437 0.12 3.62 2A 7.5 963 0.15 4.11 2B 7.7 1,654 0.16 3.23 3A 7.9 1,934 0.15 3.82 3B 7.8 3,276 0.26 1.07 4A 7.8 1,272 0.15 0.88 4B 7.7 1,694 0.14 1.27 5A 7.9 2,141 0.15 1.66 5B 7.6 1,990 0.17 1.86 6A 7.6 1,689 0.15 2.55 6B 7.8 740 0.15 1.95 7A 7.5 1,192 0.16 1.86 7B 7.8 1,263 0.22 2.64 8A 7.5 1,634 0.16 3.13 8B 7.8 1,531 0.15 2.56 CONCLUSION The groundwater samples were taken at the bank of Cooum River on both sides of each station. Two groundwater samples were taken near the bank of Cooum River at all the eight stations. The water samples were subjected to the concentrations of Heavy metal ions. The result of above work shows that the most of the heavy metal ions are more than the permissible limit of WHO [4]. The result shows that the most of the groundwater sampling stations are polluted by the intrusion of Cooum river water, dumping of waste and percolation of domestic sewage by inhabitants. Even though, the condition is very bad at present, but if the same continues in future groundwater source Mn 0.07 0.07 0.07 0.06 0.06 0.06 0.05 0.08 0.07 0.06 0.07 0.06 0.07 0.06 0.01 0.08 Cu 0.55 0.52 0.66 0.57 0.61 0.61 0.68 0.62 0.61 0.65 0.66 0.55 0.66 0.61 0.59 0.65 Pb 0.01 0.01 0.01 0.01 0.06 0.01 0.01 0.01 0.02 0.02 0.07 0.01 0.02 0.01 0.01 0.02 Fe 1.92 1.85 2.05 1.86 2.56 0.55 1.25 1.65 2.74 0.75 2.59 1.95 1.86 1.45 2.25 1.46 Ni 0.12 0.27 0.15 0.08 0.14 0.24 0.11 0.15 0.07 0.08 0.25 0.15 0.15 0.14 0.12 0.27 76
A. Zahir Hussain and K. M. Mohamed Sheriff J. Chem. Pharm. Res., 2013, 5(3):73-77 ______________________________________________________________________________ will be completely polluted and become unfit for drinking and other purposes. This observation indicates contamination of the environment. Therefore, most of the water from these wells is suitable for domestic use and its unlikely to pose a major health risk to consumers. Hence, it is high time to preserve and protect this valuable ground source. Thus dumping of waste polluted materials should be avoided and they should not be let into the river. Hence lot of precaution should be done to avoid consequence. REFERENCES [1]Neerja Kalra, Rajesh Kumar, S. S. Yadav and R. T. Singh, Journal of Chemical and Pharmaceutical Research, 2012, 4(3):1782-1786 [2]Odoh Rapheal and Kolawole Sunday Adebayo, Water Resources Development,1997, 13, 79-92 [3] Karthikeyan T.P, Sahikumar J.M and Ramesh M. Pollution Research, 2002, 21 (1):21-23 [4]WHO (World Health Organization), International standards for drinking water, Geneva WHO (1998) [5]Abdul Jameel A and Sirajudeen, Journal of Ecotoxicology and Environment Monitoring. (2006) Vol.16 (5) 443- 446 [6] S. B. Borul and P. K. Banmeru, Journal of Chemical and Pharmaceutical Research, 2012, 4(5):2603-2606 [7]Aggarwal T R, Sinh K N and Gupta A K, Poll.Res. (2000) 19 (13): 491-494 [8]Sharpley A J and Menzel R G, Adv.Agron. (1987) 41 : 297-324 [9]APHA (American Public Health Association), Standard method for examination of water and waste water New York, 20th edition. 1998 [10] Brown, E., Skougsted, M.W., & Fishman. M.J. (1974). Methods for collection and analysis of Water sample for dissolved minerals and gases. US Department of interior, Book [11]Azeez, P.A, Nadaraja N.R and Mittal, D.D, India. Pollution Research, 2000. 19(3), 377- 385 [12]Jha, A. N., & Verma, P.K, Pollution Research, 2000, 19(2), 75- 85. [13]Abdul Jameel A, India Journal of Environmental Health, 2002. 44(2), 108-112 [14]Abdul Jameel A and Zahir Hussain A, Environ Monit Asses.2011. DOI. 10, 1007/s10661-011-1910-4 [15]Jain C K, Bhatia K K S and Kumar S R, Indian Journal of Environmental Protection, 2003, 23 (3), 32-329 [16]Mehta, B, H., & Churi, A.J. Indian journal of Pollution Control, 1996, 12(2),153-162. [17]Senthil Kumar R D, Narayanaswamy R and Ramakrishnan K, Poll.Res.2001 (1) 93-97 [18]Warmate A.G., T.J.K. ideriah, Journal of Ecology and the Natural Environmental, 2011, Vol. 3(2), pp.54-57 [19]K. Prakash, V. Hanuman Reddy, R. Chenna Krishna Reddy, P. M. N Prasad, V. Krishanaiah and Y. V. Rami Reddy, Journal of Chemical and Pharmaceutical Research, 2012, 4(2):1239-1245 [20]V. Balakrishnan, S. Arivoli, A. Shajudha Begum and A. Jafar Ahamed, J. Chem. Pharm. Res., 2010, 2(6):176- 190 176 77