Download
1 / 12
120 likes | 247 Vues
Cefpodoxime proxetil is commonly used antibacterial drug. Thermal analysis and dissolution studies are<br>routinely conducted by pharmaceutical industries in order to evaluate the drug stability, the drugexcipient<br>interaction and compatibility. In this study dynamic thermogravimetry (TG) experiments were<br>performed in flowing dry air atmosphere (20 ml min-1) to investigate the thermal decomposition of<br>cefpodoxime proxetil drug and tablets (A, B and C) containing different excipients. The TG curve of<br>cefpodoxime proxetil drug shows single decomposition process while tablets (A, B and C) display two.<br>Decomposition activation energies and thermal rate constant (kT) were determined using model-free<br>methods viz. Kissinger, Friedman, Flynn-Wall-Ozawa, and modified Coats-Redfern. The dissolution study<br>of samples was carried out in accordance of United State Pharmacopeia (USP 32) and Kitazawa<br>equation was used for kinetics. Samples are found to have following sequence of the thermal stability:<br>tablet B < cefpodoxime proxetil drug < tablet A < tablet C and the dissolution order: tablet B <<br>cefpodoxime proxetil drug < tablet A < tablet C. The thermal rate constant (kT) and dissolution rate<br>constant (kD) were also correlated graphically and found to have very good correlation with regression<br>coefficient close to 1. <br>

E N D
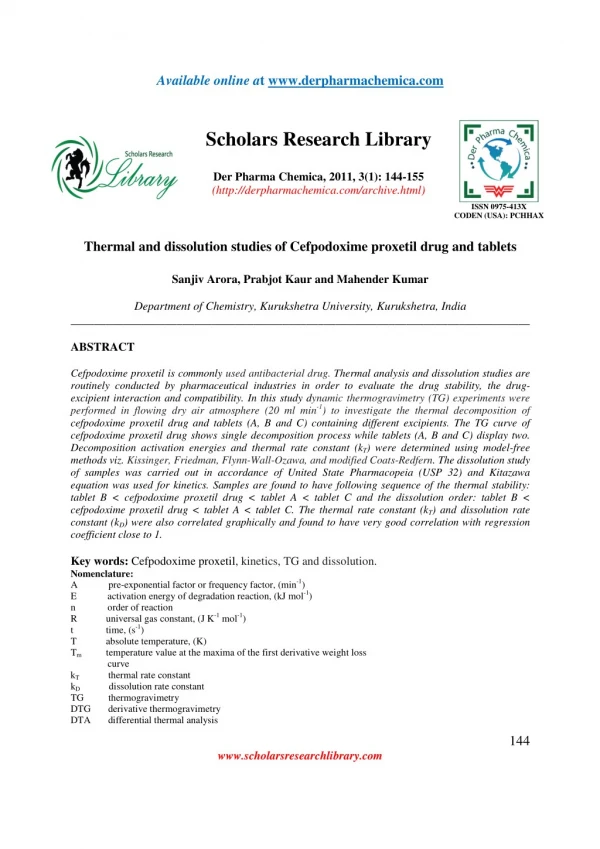
Available online at www.derpharmachemica.com Scholars Research Library Der Pharma Chemica, 2011, 3(1): 144-155 (http://derpharmachemica.com/archive.html) ISSN 0975-413X CODEN (USA): PCHHAX Thermal and dissolution studies of Cefpodoxime proxetil drug and tablets Sanjiv Arora, Prabjot Kaur and Mahender Kumar Department of Chemistry, Kurukshetra University, Kurukshetra, India ______________________________________________________________________________ ABSTRACT Cefpodoxime proxetil is commonly used antibacterial drug. Thermal analysis and dissolution studies are routinely conducted by pharmaceutical industries in order to evaluate the drug stability, the drug- excipient interaction and compatibility. In this study dynamic thermogravimetry (TG) experiments were performed in flowing dry air atmosphere (20 ml min-1) to investigate the thermal decomposition of cefpodoxime proxetil drug and tablets (A, B and C) containing different excipients. The TG curve of cefpodoxime proxetil drug shows single decomposition process while tablets (A, B and C) display two. Decomposition activation energies and thermal rate constant (kT) were determined using model-free methods viz. Kissinger, Friedman, Flynn-Wall-Ozawa, and modified Coats-Redfern. The dissolution study of samples was carried out in accordance of United State Pharmacopeia (USP 32) and Kitazawa equation was used for kinetics. Samples are found to have following sequence of the thermal stability: tablet B < cefpodoxime proxetil drug < tablet A < tablet C and the dissolution order: tablet B < cefpodoxime proxetil drug < tablet A < tablet C. The thermal rate constant (kT) and dissolution rate constant (kD) were also correlated graphically and found to have very good correlation with regression coefficient close to 1. Key words: Cefpodoxime proxetil, kinetics, TG and dissolution. Nomenclature: A pre-exponential factor or frequency factor, (min-1) E n order of reaction R universal gas constant, (J K-1 mol-1) t time, (s-1) T absolute temperature, (K) Tm temperature value at the maxima of the first derivative weight loss curve kT thermal rate constant kD dissolution rate constant TG thermogravimetry DTG derivative thermogravimetry DTA differential thermal analysis activation energy of degradation reaction, (kJ mol-1) 144 www.scholarsresearchlibrary.com
Sanjiv Arora et al ______________________________________________________________________________ Der Pharma Chemica, 2011, 3 (1):144-155 DSC differential scanning calorimetry O-F-W Ozawa-Flynn-Wall PVP Polyvinylpyrrolidone MCCP microcrystalline cellulose powder CMC calcium carboxy methyl cellulose Greek α degree of conversion or degree of decomposition or the fraction reacted β linear heating rate, (K min-1) ______________________________________________________________________________ INTRODUCTION Cefpodoxime proxetil is an orally administered, extended spectrum, semi synthetic antibiotic of the cephalosporin class. Cefpodoxime is a pro drug; its active metabolite is cefpodoxime. Cefpodoxime proxetil, a relatively new broad spectrum third-generation cephalosporin, has very well in vitro activity against Enterobacteriaceae, Hemophilus spp and Moraxella spp, including lactamase producers and many strains resistant to other oral agents. It also has activity against Gram-positive bacteria, especially against Streptococci. It is well tolerated and is one of the first third generation cephalosporins to be available in oral form [1]. A drug is most oftenly taken along with other chemical substances known as excipients. Excipients are traditionally thought of as inert but they can have a tremendous impact on the ultimate pharmacological availability of a drug substance when added to a formulation. They may either alter the activity of drug or can slow down the action of drug. The magnitude of drug- excipient interactions will depend on the characteristics of the drug and on the quantity and properties of the excipients. Moreover, Interaction between pharmaceutical drugs and excipients may generate several compatibility problems which in turn affect the stability of the formulation [2]. Therefore, it becomes important to study thermal stability, thermal degradation, dissolution profile and kinetics of drug and tablet to determine the drug-excipient interactions. Thermal analysis is an essential analytical tool used in preformulation for the study of polymorphism; in development of new formulations and to study the interaction between drugs and excipients [3-7]. TG provides important data on the evaluation of stability to study the pharmaceutical formulation [8]. The application of thermal methods, and especially DTA, DSC and TG is of great importance in the solution of pharmaceutical problems such as the determination of purity, the quantitative and qualitative analysis of drug formulations, tests of stability and the determination of kinetic parameters [9-11]. Further, the calculation of degradation kinetics using single heating rate method is facing criticism due to problematic procedures and unreliable results [12-13]. On the other hand, the use of multiple heating rate methods e.g. Kissinger [14], Friedman [15], Ozawa-Flynn-Wall (O-F-W) [16-17] and Coasts- Redfern (modified) [18-19] methods is preferred [20-21]. Dissolution test has emerged in the pharmaceutical field as a very important tool to characterize drug product performance [22]. It is well known that the bioavailability of drugs is influenced by their dissolution characteristics [23-25]. The comparison of dissolution profiles has extensive application throughout the product development process and can be used to: develop in vitro-in vivo correlation, establish final dissolution specifications for the pharmaceutical dosage form and establish the similarity of pharmaceutical dosage forms [26]. In the development of a new 145 www.scholarsresearchlibrary.com
Sanjiv Arora et al ______________________________________________________________________________ Der Pharma Chemica, 2011, 3 (1):144-155 pharmaceutical formulation, is important to identify the interaction among the components based in their physical and chemical characteristics which can study the further stability problems [27]. A.P. Barreto Gomes et al. [28]correlated the thermal and dissolution kinetics of Ampicillin drug and capsules. The correlation between kT (thermal rate constant) and kD (dissolution rate constant) can be used to study the preformulation of drug and also as a parameter of pharmaceutical equivalence. Kitazawa equation [29-30] has been employed for the determination of dissolution rate constant. Similar to above scheme, F.S. De Souza et al. [31] showed the correlation between thermal and dissolution rate constants of Cimetidinedrug and tablets. It was suggested that correlation between kT/kD seems to be a suitable method for detecting possible interactions between cimetidine drug and excipients. M. Wesolowski et al. [32] has reported the thermal decomposition and kinetics of Antituberculousdrug using Kissinger method. A.C.D. de Medeiros et al. [33]has reported the use of dynamic and isothermal TG, conventional DSC and DSC photo visual coupled methods to characterize and thus to check the compatibility of Paracetamol drug and excipient in different formulations. Also, degradation kinetic parameters (Ozawa method) were used to study the drug-excipient interactions. N. A. B. de Souza et al. [34] applied Arrhenius equation to calculate the thermal stability order of Metronidazoledrug and tablets. The aim of this project is to study the effect of different excipients on the dissolution and thermal profile of cefpodoxime proxetil drug and to find out correlation between them kinetically. A correlation between these two parameters can be of interest in predicting the stability of formulations, possible drug-excipient interactions and compatibility. MATERIALS AND METHODS Experimental The samples were cefpodoxime drug, tablets with different excipients. Cefpodoxime proxetil drug and tablet A, B and C (containing 200 mg cefpodoxime proxetil) were analyzed. Excipients present in tablet A were magnesium stearate, primogel, cross povidone, calcium carboxy methyl cellulose, pharmatose and excipients present in tablet B were starch, aerosil, talc, croscarmellose sodium, PVP K-30 (Polyvinylpyrrolidone) and microcrystalline cellulose powder (MCCP). Cefpodoxime proxetil drug, tablet A and B were donated by Cure Quick Pharmaceuticals. Tablet C was acquired from a local drugstore. All samples were stored in closed plastic containers until they were needed for thermal analysis. Thermal analysis TG and DTA thermograms of the samples were recorded in dynamic air atmosphere from ambient temperature to 550 °C at a heating rate of 5, 10, 20 °C min-1 using Perkin Elmer, Diamond Thermogravimetric/Differential Thermal analyzer. The instrument was calibrated before recording the thermograms. Dried alumina powder (Al2O3) was used as reference material and aluminum sample holder was used for taking thermograms. In order to ensure the uniformity of temperature of the sample and good reproducibility, small size (2 to 4 mg) were taken. The apparatus detects the mass loss with a resolution of 0.2 µg as a function of temperature. To verify the reproducibility of obtained mass loss curve, two sample runs were performed under the same experimental conditions for each kind of drug and tablets at all selected heating rates. Activation 146 www.scholarsresearchlibrary.com
Sanjiv Arora et al ______________________________________________________________________________ Der Pharma Chemica, 2011, 3 (1):144-155 energy was calculated with a specially designed program in MS-Excel and Origin 6.1, which takes specific TG and DTG data from the Pyris manager software. Dissolution The dissolution testing for cefpodoxime proxetil drug, tablet A, B and C were conducted according to the procedure described in the United State Pharmacopeia method (USP 32). Dissolution profile was obtained by sampling at 3, 6, 9, 12, 15, 18, 21, 24, 27, 30 min. Quantization was performed by U.V. at 259 nm by measuring the absorbance of filtered portions of the solution under test in comparison with a reference solution having a known concentration of cefpodoxime proxetil standard. RESULTS AND DISCUSSION TG Studies Fig. 1 presents the overall thermogravimetric decomposition process of cefpodoxime proxetil drug and tablet (A, B and C) at a heating rate of 10 °C min-1. The cefpodoxime proxetil drug showed single step decomposition, in the temperature interval 150-350 °C and had a residual weight of 37.2%. On the other hand, tablet (A, B and C) showed two step decomposition process which started at about 150 °C and completed in the temperature range of 270-280 °C. The onset decomposition temperature corresponding to 1% weight loss (TO) and temperature at 10% weight loss (T10) were found lowest for drug 106.0/208.5 °C in comparison to tablets i.e. for tablet A, B and C 110.2/225.9, 154.8/227.5 and 139.5/226.7 °C (TO/T10) respectively (Table 1). This data show the presence of some strong low temperature drug-excipient interactions which has increased the onset decomposition temperature from 106.0 (drug) to 154.8 °C (tablet B). According to the TO and T10 obtained from thermograms, initial stability order is: tablet B > tablet C > tablet A > drug. This order suggests that the tablets are less susceptible to thermal decomposition as compared to drug. 100 Drug Tablet A Tablet B Tablet C 80 Weight (%) 60 40 20 0 100 200 300 400 500 600 Temperature (°C) Fig. 1 TG of drug, tablet A, B and C at heating rate of 10 °C min-1 in dynamic air atmosphere 147 www.scholarsresearchlibrary.com
Sanjiv Arora et al ______________________________________________________________________________ Der Pharma Chemica, 2011, 3 (1):144-155 Table 1 TG and DTG data for drug and tablets. Temperature at 1% wt. loss ( TO) (°C) 106.0 Temperature at 10% wt. loss (T10) (°C) 208.5 Sample DTG Peak Temperature (°C) Mass at 500°C (%) Maximum degradation rate (% min-1) Drug Tablet A Tablet B Tablet C 246.9 243.8 348.6 243.6 37.0 5.7 3.5 3.6 3.4 110.2 226.2 41.5 154.8 228.0 41.2 320.4 3.7 242.4 334.6 2.4 6.7 139.5 227.2 41.2 Drug showed a single broad DTG curve peaking at 248.0 °C while two peaks were observed for each tablet. The first and second peak occurs in the temperature range 242-244 °C and 320-349 °C, respectively. First peak corresponds to the decomposition of drug while the second occurs due to excipients decomposition. Also, it can be noticed from the Table 1 that maximum degradation rate value corresponding to the first DTG peak for drug shifted to lower values for tablets. It means the presence of excipients decreased the drug decomposition rate and thereby increasing the drug stability. Further, tablets had higher percentage weight values at 500 °C than drug, which might be due to the presence of some inorganic excipients (e.g. magnesium stearate, talc and aerosil etc.) which are thermally stable upto 500 °C. Kinetic studies TG thermograms of samples (drug, tablet A, B and C) showed two important areas of weight loss. Because of the two-step nature of thermal decomposition process, it was necessary to determine and use different kinetic parameters to describe the thermal degradation over the entire temperature range. Therefore, the kinetic parameters of each sample were determined for the first and second stage separately. In this study four multiple heating rate methods viz. Kissinger [14], Friedman [15], O-F-W [16-17] and Coats–Redfern method [18-19] were used to calculate degradation activation energy. Table 2 Final equations of various kinetic methods used in the study Method Final Equation AE ( log )) (g( log − = α Plots E log β against 1/T β − − ) log ( ) 2.315 0.4567 O-F-W R (ln( d RT β 2 /T ) ) m E 2) ln(β/Tm against 1/Tm = − Kissinger (1/T d d ( β ) R m α α d E ln(β(dα/dT)) against 1/T = = + − α − ln ( ) ln ( )) ln A ln(1 n ) Friedman dt dT RT Coats- Redfern (modified) AR 1 E β ln(β/T2) against 1/T − − = ln ln − α ln( ) E RT 2 RT − 2 1 ( ) T E 148 www.scholarsresearchlibrary.com
Sanjiv Arora et al ______________________________________________________________________________ Der Pharma Chemica, 2011, 3 (1):144-155 The Friedman method is the iso-conversional method, which directly leads to (-E/R) for a given value of α by plotting ln(β(dα/dT)) against 1/T. The O-F-W method is also iso-conversional method but has integral equation unlike Friedman which is a differential method, which leads to -(0.4567 E/R) from the slope of line determined by plotting log β against 1/T at any degree of conversion. The modified Coats–Redfern method is a multiple-heating rate application of the Coats–Redfern equation. Plotting for each heating rate versus 1/T at that heating rate gives a series of straight lines having slope (-E/R). In the Kissinger method, the activation energy, E, can be obtained from a plot of ln(β/Tm 2) against 1/Tm for particular stage of decomposition since the slope of such line is given by (-E/R). 0.09 0.10 0.15 0.20 0.25 0.03 0.35 0.40 0.45 -2.0 -2.5 ln(β*dα/dt) -3.0 -3.5 -4.0 1.9 2.0 2.1 2.2 3/T(K -1) 10 Fig. 2 Plots of Friedman method for degradation activation energy of drug, at varying degree of conversion, in dynamic air atmosphere. 1.5 0.09 0.1 0.15 0.2 0.25 0.3 0.35 0.4 0.45 1.2 log(β) 0.9 0.6 1.9 2.0 10 2.1 2.2 3/T (K -1) Fig. 3 Plots of O-F-W method for degradation activation energy of drug, at varying degree of conversion, in dynamic air atmosphere. 149 www.scholarsresearchlibrary.com
Sanjiv Arora et al ______________________________________________________________________________ Der Pharma Chemica, 2011, 3 (1):144-155 0.09 0.1 0.15 0.20 0.25 0.30 0.35 0.4 -9.5 ln(β/T2) -10.0 -10.5 -11.0 1.85 1.90 1.95 2.00 2.05 2.10 2.15 2.20 3/T (K -1) 10 Fig. 4 Plots of Coats-Redfern (modified) method for degradation activation energy of drug, at varying degree of conversion, in dynamic air atmosphere. The plots of iso-conversional Friedman, O-F-W, and modified Coasts-Redfern methods show a general trend of activation energy. The Friedman plot for degradation activation energy of drug, at varying degree of conversion, is shown Fig. 2 while Fig. 3 and 4 show the specific results of application of O-F-W and modified Coats-Redfern methods for degradation activation energy of drug, respectively. It can be seen from these figures that the fitted lines are almost parallel, which indicates the approximate activation energy at different conversions and consequently, implying the possibility of single reaction mechanism. Table 3 Comparison of parameters obtained from the present study Friedman O-F-W E (kJ mol-1) Drug I 470.4 259.4 1.32×10⁻³ Tablet A I 196.6 171.1 1.04×10⁻³ II - - I 587.8 554.2 5.27×10⁻³ II 478.2 137.5 9.08×10⁻⁴ Degradation kinetic parameters of drug and tablets calculated using Friedman, O-F-W, Coats- Redfern and Kissinger are summarized in Table 2. The values of activation energy by all the methods (except Kissinger method) are comparatively smaller for tablet B while tablet C has the highest values for example, for the O-F-W and Coasts-Redfern (modified) methods, the first stage activation energies are 259.4, 453.4, 174.2, 554.2 and 264.2, 471.2, 205.5 and 550.9 kJ mol-1 for drug, tablet A, tablet B and tablet C, respectively. Overall sequence follows the order tablet C> tablet A> drug> tablet B. Kissinger Coats- Redfern (modified) E (kJ mol-1) 182.3 288.5 E A E Sample Stage (kJ mol-1) (min-1) (kJ mol-1) 264.2 471.2 2.96×10⁻³ 6.35×10⁻⁴ I 497.0 453.4 II 198.0 174.2 156.4 193.5 211.1 - 130.4 146.4 205.5 - 550.9 228.9 Tablet B - Tablet C 150 www.scholarsresearchlibrary.com
Sanjiv Arora et al ______________________________________________________________________________ Der Pharma Chemica, 2011, 3 (1):144-155 Fig. 5 shows the linear plot for drug from Kissinger method. Activation energy calculated by this method for first stage was found to be 182.3, 288.5, 211.1 and 130.4 kJ mol-1 for drug, tablet A, tablet B and tablet C, respectively. The values calculated by Kissinger method showed reverse trend i.e. tablet A > tablet B > drug > tablet C. -9.5 -10.0 -10.5 2) ln(β/Tm -11.0 -11.5 1.88 1.90 1.92 1.94 1.96 3/Tm(K -1) 10 Fig. 5 Plots of Kissinger method for degradation activation energy of drug, in dynamic air atmosphere. This deviation originate from the fact that Kissinger’s methodutilizes the assumption of f(1-α) = (1-α)n. So, it becomes almost certain to obtain systematic deviation in the Kissingermethod equation, dependent upon n. Meanwhile, Friedman’s method like O-F-Wprocedure, makes no assumptions about f(1-α), and therefore, both are capable of providing reasonably reliable data from temperature programmed TG [15]. Table 4 Thermal rate constant obtained from O-F-W method Samples Kinetic parameters Drug 7.5 ×10⁻⁴ Tablet A 15.2 ×10⁻⁴ Tablet B 5.7×10⁻⁴ Tablet C 17.3×10⁻⁴ kT (min-1) Results obtained in the present study revealed the fact that, the kinetic parameters obtained for the first stage are higher than those for the second stage of decomposition of tablets. The kinetic parameters confirmed compatibility and a lower stability of different tablets due to presence of different excipient in them. The rate constants obtained from the TG data for the drug and tablets provided evidence of difference between the formulations. The value of rate constant for tablet B is lowest while highest for tablet C. This shows that tablet B is thermally more stable than others which can be attributed to the presence of some highly thermally stable inorganic excipients like aerosil and talc in it [35]. Some workers has reported the thermal stability order based on kT values [28, 31, 34]. The rate constant obtained from TG data presents following sequence of thermal stability: tablet B > drug > tablet A > tablet C. 151 www.scholarsresearchlibrary.com
Sanjiv Arora et al ______________________________________________________________________________ Der Pharma Chemica, 2011, 3 (1):144-155 Dissolution study Figure 6 shows dissolution profiles of the three tablets and drug. The dissolution of tablets containing 200 mg of cefpodoxime proxetil drug substance served as a control. Dissolution rate constant data showed different kinetic dissolution behaviour of drug and tablets. It can be seen that tablet B exhibited a dissolution profile similarly to cefpodoxime drug substance. The dissolution of tablet B, however, was slightly better than that of drug. Tablet C showed the poorest release profile of all formulations. It can be said there might occurred some attractive forces between drug and excipients in case of tablets C and A. On the other hand some what better release of drug in case of tablet B can be attributed repulsive forces which have caused better disintegration and thus better dissolution. 8 Amount of drug dissolved(mcg) Drug Tablet A Tablet B Tablet C 6 4 2 0 0 3 6 9 12 15 18 21 24 27 30 Time (min) Fig. 6 Dissolution profiles of the cefpodoxime proxetil drug and its tablets. Dissolution Kinetics The dissolution rate constant (kD) was determined by the Kitazawa equation: ln W∞ / (W∞-Wt) = kDt Where, W∞ is the amount of drug released in solution at infinite time, Wt is the amount of dissolved drug and kD is the dissolution rate constant. The kD values obtained for drug, tablet A, B and C are shown in the Table 4. Tablet B has the fastest rate of dissolution while tablet C has the lowest. The rate constant obtained from Kitazawa equation presents following sequence of dissolution order: tablet B > drug > tablet A > tablet C. Dissolution rate constant data showed different kinetic dissolution behavior amongst drug, tablets (A, B and C). Thus, the use of a kinetic method can cleanly demonstrate the difference between the dissolution profiles of pharmaceuticals. Table 5 Dissolution rate constant obtained from Kitazawa equation Dissolution rate constant Drug kD (mcg min-1) 3.84 ×10⁻² The rate constant obtained from dissolution data presents following sequence of dissolution order: tablet B > drug > tablet A > tablet C. Samples Tablet A 3.36 ×10⁻² Tablet B 3.93×10⁻² Tablet C 3.08 ×10⁻² 152 www.scholarsresearchlibrary.com
Sanjiv Arora et al ______________________________________________________________________________ Der Pharma Chemica, 2011, 3 (1):144-155 Correlation study The aim of this work is to study the correlation between dissolution and thermal degradation rate constants. A correlation between these two parameters can be of interest in predicting the stability of formulations and possible drug excipient interactions. Both rate constants kT and kD shows the similar order. From both the orders it can be seen that tablet B has highest thermal stability and show best dissolution profile. On the other side tablet C shows lowest thermal stability and poorest dissolution profile. An evaluation was made to check that there was statistically significant correlation Fig. 7 between the two variables kT and kD. It can be observed from the figure that there exists good correlation between thermal rate constants (kT) and dissolution rate constants (kD), obeying a linear function, with correlation coefficient value close to 1 i.e. 0.9909. Linear Regression Y = A + B * X Parameter A 0.04362 B -7.01674 0.0018 Value Error 8.37968E-4 0.6718 Tablet C 0.0016 Tablet A 0.0014 R -0.99096 6.63124E-4 SD -1) kT (min 0.0012 0.0010 0.0008 Drug 0.0006 Tablet B 0.0004 0.030 0.032 0.034 0.036 0.038 0.040 kD (mcg/min) Fig. 7 Correlation between kT and kD. The thermal and dissolution rate constants presented a good correlation among drug, tablets (A, B and C). Therefore, correlation between variables kT/kD seems to be a suitable method for detecting possible interactions between cefpodoxime proxetil drug substance and its excipients in development or after manufacturing changes particularly for immediate release dosage forms and therefore could be especially useful in a quality control environment [31]. Thus, the thermal and dissolution kinetics can be used to confirm pharmaceutical equivalence between reference and test products [28]. The kinetic thermal and dissolution order are: tablet B > drug > tablet A > tablet C. CONCLUSION The thermal and dissolution kinetic data showed evidence of difference between the tablets formulations. The thermal and dissolution rate constants follow the same order i.e. tablet B > cefpodoxime proxetil drug > tablet A > tablet C. 153 www.scholarsresearchlibrary.com
Sanjiv Arora et al ______________________________________________________________________________ Der Pharma Chemica, 2011, 3 (1):144-155 Acknowledgements One of the authors Mahender Kumar is highly thankful to Kurukshetra University, Kurkshetra for providing University Research scholarship. We are deeply indebted to Mr. Rajesh Chawla and Mr. Harish Digani, proprietors, R.S. Laboratories, Pontasahib, Himachal Pradesh, for providing necessary drug and tablets. REFERENCES [1] H.A. Merchant, H.M. Shoaib, J.Tazeen, R.I. Yousuf, AAPs Pharm. Sci. Tech, 2006, 7(3), E1. [2] V.A. Drebushchak, T.P. Shakhtshneider, S.A. Apenina, A.S. Madvedeva, L.P. Safronova, V.V. Boldyrev, J. Therm. Anal. Calorim., 2006, 8, 303. [3] R.O. Macedo, T.G. Do Nascimento, C.S.F.S. Aragao, A.P. Barreto Gomes, J. Therm. Anal. Cal.,2000, 59, 657. [4] R.O. Macedo, A.G. De Souza, A.M.C. Macedo, J. Therm. Anal. Cal., 1997, 49, 937. [5] R.O. Macedo, C.S.F.S. Aragao, T.G. Do Nascimento, A.M.C. Macedo, J. Therm. Anal. Cal., 1999, 56, 1323. [6] D.J. Giron, M. Darchi, J. Therm. Anal. Cal., 1997, 49, 913. [7] D.J. Giron, Pharm. Biomed. Anal., 1986, 4, 755. [8] D.J. Giron, J. Therm. Anal. Calorim., 2002, 8, 335. [9] M. Wesolowski, J. Therm. Anal. Cal., 1992, 38, 2239. [10] D. Dollimore, Thermochim. Acta, 1996, 284, 115. [11] M. Ionashiro, Thermochim. Acta, 1996, 279, 177. [12] A.K. Burham, Thermochim Acta, 2000, 355, 165. [13] S. Vyazovkin, Thermochim Acta, 2000, 355, 155. [14] H.E. Kissinger, Anal. Chem., 1957, 29, 1702. [15] H.L. Friedman, J. Polym. Sci, 1964, 61, 183. [16] T. Ozawa, Bull. Chem. Soc. Jpn., 1965, 38, 1881. [17] J.H. Flynn, L.A. Wall, Polym. Lett., 1966, 4, 323. [18] A.K. Burnham, R.L. Braun, Energy fuels, 1999, 13, 1. [19] P. Kofsta, Nature,1957, 179, 1362. [20] S. Arora, M. Kumar, G. P. Dubey, J. Energy Instit., 2009, 82(3), 138. [21] S. Arora, R. Bagoria, M. Kumar, J. Therm. Anal. Cal., 2010, 102, 375.. [22] V. Gray, G. Kelly, M. Xia, C. Butler, S. Thomas, S. Mayock, Pharmaceutical Research, 2009. [23] J.L. Ford, P. Timmins, Pharmaceutical Thermal analysis, Ellis Horwood, Chichester, 1989, 55. [24] P.V. Marshall, D.G. Pope, J.T. Carstensen, J. Pharma. Sci., 1991, 80, 899. [25] M. Morita and S. Hirota, J. Pharm. Sci., 1998, 87, 694. [26] Th. O’ Hara, A. Dunne, J. Butler, J. Devane, Res. Focus, 1998, 5, 214. [27] R.O.C. Filho, P.I.B.M. Franco, E.C. Conceicao, M.I.G. Leles, J. Therm. Anal. Cal.,2009, 97, 343. [28] A.P. Barreto Gomes, F.S. Souza and R.O.Macedo, J. Therm. Anal. Cal., 2003, 72, 545. [29] S. Kitazawa, I. Johno, Y. Ito, S. Teramura and J. Okada, J. Pharm. Pharmacol., 1975, 27 765. [30] S. Kitazawa, I. Johno, T. Minouchi and J. Okada, J. Pharm. Pharmacol., 1977, 29 453. 154 www.scholarsresearchlibrary.com
Sanjiv Arora et al ______________________________________________________________________________ Der Pharma Chemica, 2011, 3 (1):144-155 [31] F.S. de Souza, I.D. Basilio Jr., E.J. Oliveira, R.O. Macedo, J. Therm. Anal. Cal.2003, 72, 549. [32] M. Wesolowski, T. Konarski, J. Therm. Anal. Cal., 1995, 45, 1199. [33] A.F.D. Medeiros, A.F.O. Santos, F.S. De Souza, J.V.V. Procopio, M.F. Pinto, R.O. Macedo. J. Therm. Anal. Cal., 2007, 88, 377. [34] N.A.B. De Souza, A.C.D. Medeiros, A.F.O. Santos, R.O. Macedo, J. Therm. Anal. Cal., 2003, 72, 535. [35] S. Esezobo, J Pharm Pharmacol, 1985, 37 (3), 193. 155 www.scholarsresearchlibrary.com