Chapter 8 Project Management
Introduction to Management Science 8th Edition by Bernard W. Taylor III. Chapter 8 Project Management. Chapter Topics. The Elements of Project Management The Project Network Probabilistic Activity Times Activity-on-Node Networks and Microsoft Project


Chapter 8 Project Management
E N D
Presentation Transcript
Introduction to Management Science 8th Edition by Bernard W. Taylor III Chapter 8 Project Management Chapter 8 - Project Management
Chapter Topics • The Elements of Project Management • The Project Network • Probabilistic Activity Times • Activity-on-Node Networks and Microsoft Project • Project Crashing and Time-Cost Trade-Off • Formulating the CPM/PERT Network as a Linear Programming Model Chapter 8 - Project Management
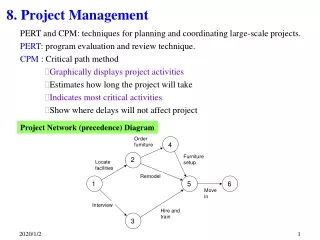
Overview • Uses networks for project analysis. • Networks show how projects are organized and are used to determine time duration for completion. • Network techniques used are: • CPM (Critical Path Method) • PERT (Project Evaluation and Review Technique) • Developed during late 1950’s. Chapter 8 - Project Management
Elements of Project Management • Management is generally perceived as concerned with planning, organizing, and control of an ongoing process or activity. • Project Management is concerned with control of an activity for a relatively short period of time after which management effort ends. • Primary elements of Project Management to be discussed: • Project Team • Project Planning • Project Control Chapter 8 - Project Management
The Elements of Project Management The Project Team • Project team typically consists of a group of individuals from various areas in an organization and often includes outside consultants. • Members of engineering staff often assigned to project work. • Most important member of project team is the project manager. • Project manager is often under great pressure because of uncertainty inherent in project activities and possibility of failure. • Project manager must be able to coordinate various skills of team members into a single focused effort. Chapter 8 - Project Management
The Elements of Project Management The Project Network • A branch reflects an activity of a project. • A node represents the beginning and end of activities, referred to as events. • Branches in the network indicate precedence relationships. • When an activity is completed at a node, it has been realized. Figure 8.2 Network for Building a House Chapter 8 - Project Management
The Project Network Planning and Scheduling • Network aids in planning and scheduling. • Time duration of activities shown on branches: Figure 8.3 Network for Building a House with Activity Times Chapter 8 - Project Management
The Project Network Concurrent Activities • Activities can occur at the same time (concurrently). • A dummy activity shows a precedence relationship but reflects no passage of time. • Two or more activities cannot share the same start and end nodes. Figure 8.4 Expanded Network for Building a House Showing Concurrent Activities Chapter 8 - Project Management
The Project Network Paths Through a Network Table 8.1 Paths Through the House-Building Network Chapter 8 - Project Management
The Project Network The Critical Path (1 of 2) • The critical path is the longest path through the network; the minimum time the network can be completed. In Figure 8.5: • Path A: 1 2 3 4 6 7, 3 + 2 + 0 + 3 + 1 = 9 months • Path B: 1 2 3 4 5 6 7, 3 + 2 + 0 + 1 + 1 + 1 = 8 months • Path C: 1 2 4 6 7, 3 + 1 + 3 + 1 = 8 months • Path D: 1 2 4 5 6 7, 3 + 1 + 1 + 1 + 1 = 7 months Chapter 8 - Project Management
The Project Network The Critical Path (2 of 2) Figure 8.6 Alternative Paths in the Network Chapter 8 - Project Management
The Project Network Activity Scheduling – Earliest Times • ES is the earliest time an activity can start. ESij = Maximum (EFi) • EF is the earliest start time plus the activity time. EFij = ESij + tij Figure 8.7 Earliest Activity Start and Finish Times Chapter 8 - Project Management
The Project Network Activity Scheduling – Earliest Times • LS is the latest time an activity can start without delaying critical path time. LSij = LFij - tij • LF is the latest finish time. LFij = Minimum (LSj) Figure 8.8 Latest Activity Start and Finish Times Chapter 8 - Project Management
The Project Network Activity Slack • Slack is the amount of time an activity can be delayed without delaying the project. • Slack Time exists for those activities not on the critical path for which the earliest and latest start times are not equal. • Shared Slack is slack available for a sequence of activities. Figure 8.9 Earliest and Latest Activity Start and Finish Times Chapter 8 - Project Management
The Project Network Calculating Activity Slack Time (1 of 2) • Slack, Sij, computed as follows: Sij = LSij - ESij or Sij = LFij - EFij Figure 8.10 Activity Slack Chapter 8 - Project Management
The Project Network Calculating Activity Slack Time (2 of 2) Table 8.2 Activity Slack Chapter 8 - Project Management
Probabilistic Activity Times • Activity time estimates usually can not be made with certainty. • PERT used for probabilistic activity times. • In PERT, three time estimates are used: most likely time (m), the optimistic time (a) , and the pessimistic time (b). • These provide an estimate of the mean and variance of a beta distribution: • mean (expected time): • variance: Chapter 8 - Project Management
Probabilistic Activity Times Example (1 of 3) Figure 8.11 Network for Installation Order Processing System Chapter 8 - Project Management
Probabilistic Activity Times Example (2 of 3) Table 8.3 Activity Time Estimates for Figure 8.11 Chapter 8 - Project Management
Probabilistic Activity Times Example (3 of 3) Figure 8.12 Network with Mean Activity Times and Variances Chapter 8 - Project Management
Probabilistic Activity Times Earliest and Latest Activity Times and Slack Figure 8.13 Earliest and Latest Activity Times Chapter 8 - Project Management
Probabilistic Activity Times Earliest and Latest Activity Times and Slack Table 8.4 Activity Earliest and Latest Times and Slack Chapter 8 - Project Management
Probabilistic Activity Times Expected Project Time and Variance • The expected project time is the sum of the expected times of the critical path activities. • The project variance is the sum of the variances of the critical path activities. • The expected project time is assumed to be normally distributed (based on central limit theorem). • In example, expected project time (tp) and variance (vp) interpreted as the mean () and variance (2) of a normal distribution: • = 25 weeks • 2 = 6.9 weeks Chapter 8 - Project Management
Probability Analysis of a Project Network (1 of 2) • Using normal distribution, probabilities are determined by computing number of standard deviations (Z) a value is from the mean. • Value is used to find corresponding probability in Table A.1, Appendix A. Chapter 8 - Project Management
Probability Analysis of a Project Network (2 of 2) Figure 8.14 Normal Distribution of Network Duration Chapter 8 - Project Management
Probability Analysis of a Project Network Example 1 (1 of 2) • Z value of 1.90 corresponds to probability of .4713 in Table A.1, Appendix A. Probability of completing project in 30 weeks or less: (.5000 + .4713) = .9713. • 2 = 6.9 = 2.63 • Z = (x-)/ = (30 -25)/2.63 = 1.90 Chapter 8 - Project Management
Probability Analysis of a Project Network Example 1 (2 of 2) Figure 8.15 Probability the Network Will Be Completed in 30 Weeks or Less Chapter 8 - Project Management
Probability Analysis of a Project Network Example 2 (1 of 2) • Z = (22 - 25)/2.63 = -1.14 • Z value of 1.14 (ignore negative) corresponds to probability of .3729 in Table A.1, appendix A. • Probability that customer will be retained is .1271 Chapter 8 - Project Management
Probability Analysis of a Project Network Example 2 (2 of 2) Figure 8.16 Probability the Network Will Be Completed in 22 Weeks or Less Chapter 8 - Project Management
Probability Analysis of a Project Network CPM/PERT Analysis with QM for Windows Exhibit 8.1 Chapter 8 - Project Management
Activity-on-Node Networks and Microsoft Project • The project networks developed so far have used the “activity-on-arrow” (AOA) convention. • “Activity-on-node” (AON) is another method of creating a network diagram. • The two different conventions accomplish the same thing, but there are a few differences. • An AON diagram will often require more nodes than an AOA diagram. • An AON diagram does not require dummy activities because two “activities” will never have the same start and end nodes. • Microsoft Project handles only AON networks. Chapter 8 - Project Management
Activity-on-Node Networks and Microsoft Project Node Structure This node includes the activity number in the upper left-hand corner, the activity duration in the lower left-hand corner, and the earliest start and finish times, and latest start and finish times in the four boxes on the right side of the node. Figure 8.17 Activity-on-Node Configuration Chapter 8 - Project Management
Activity-on-Node Networks and Microsoft Project AON Network Diagram Figure 8.18 House-Building Network with AON Chapter 8 - Project Management
Activity-on-Node Networks and Microsoft Project Microsoft Project (1 of 4) Exhibit 8.2 Chapter 8 - Project Management
Activity-on-Node Networks and Microsoft Project Microsoft Project (2 of 4) Exhibit 8.3 Chapter 8 - Project Management
Activity-on-Node Networks and Microsoft Project Microsoft Project (3 of 4) Exhibit 8.4 Chapter 8 - Project Management
Activity-on-Node Networks and Microsoft Project Microsoft Project (4 of 4) Exhibit 8.5 Chapter 8 - Project Management
Project Crashing and Time-Cost Trade-Off Definition • Project duration can be reduced by assigning more resources to project activities. • Doing this however increases project cost. • Decision is based on analysis of trade-off between time and cost. • Project crashing is a method for shortening project duration by reducing one or more critical activities to a time less than normal activity time. • Crashing achieved by devoting more resources to crashed activities. Chapter 8 - Project Management
Project Crashing and Time-Cost Trade-Off Example Problem (1 of 5) Figure 8.19 Network for Constructing a House Chapter 8 - Project Management
Project Crashing and Time-Cost Trade-Off Example Problem (2 of 5) Crash cost and crash time have linear relationship: total crash cost/total crash time = $2000/5 = $400/wk Figure 8.20 Time-Cost Relationship for Crashing Activity 12 Chapter 8 - Project Management
Project Crashing and Time-Cost Trade-Off Example Problem (3 of 5) Table 8.5 Normal Activity and Crash Data for the Network in Figure 8.19 Chapter 8 - Project Management
Project Crashing and Time-Cost Trade-Off Example Problem (4 of 5) Figure 8.21 Network with Normal Activity Times and Weekly Activity Crashing Costs Chapter 8 - Project Management
Project Crashing and Time-Cost Trade-Off Example Problem (5 of 5) • As activities are crashed, the critical path may change and several paths may become critical. Figure 8.22 Revised Network with Activity 12 Crashed Chapter 8 - Project Management
Project Crashing and Time-Cost Trade-Off Project Crashing with QM for Windows Exhibit 8.6 Chapter 8 - Project Management
Project Crashing and Time-Cost Trade-Off General Relationship of Time and Cost (1 of 2) • Project crashing costs and indirect costs have an inverse relationship. • Crashing costs are highest when the project is shortened. • Indirect costs increase as the project duration increases. • Optimal project time is at minimum point on the total cost curve. Chapter 8 - Project Management
Project Crashing and Time-Cost Trade-Off General Relationship of Time and Cost (2 of 2) Figure 8.23 A Time-Cost Trade-Off Chapter 8 - Project Management
The CPM/PERT Network Formulating as a Linear Programming Model • The objective is to determine the earliest time the project can be completed (i.e., the critical path time). General linear programming model: Minimize Z = xi subject to: xj - xi tij for all activities i j xi, xj 0 Where: xi = earliest event time of node i xj = earliest event time of node j tij = time of activity i j Chapter 8 - Project Management
The CPM/PERT Network Example Problem Formulation and Data (1 of 2) Minimize Z = x1 + x2 + x3 + x4 + x5 + x6 + x7 subject to: x2 - x1 12 x3 - x2 8 x4 - x2 4 x4 - x3 0 x5 - x4 4 x6 - x4 12 x6 - x5 4 x7 - x6 4 xi, xj 0 Chapter 8 - Project Management
The CPM/PERT Network Example Problem Formulation and Data (2 of 2) Figure 8.24 CPM/PERT Network for the House-Building Project with Earliest Event Times Chapter 8 - Project Management
The CPM/PERT Network Example Problem Solution with Excel (1 of 4) Exhibit 8.7 Chapter 8 - Project Management