Download
1 / 1
10 likes | 126 Vues
This study investigates the seasonal fluctuations of water storage in the Ob River Basin of Central Siberia through the application of satellite remote sensing techniques. By utilizing radar altimetry data and satellite imagery from various sources like Topex/Poseidon and SSM/I, we analyze twelve years of water level changes and delineate flooded areas. This research aims to improve our understanding of hydrological cycles in response to global warming, focusing on one of the largest watersheds in the Arctic.

E N D
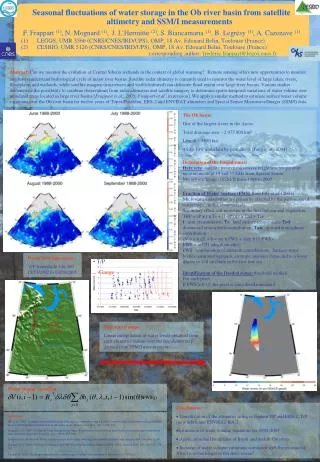
• T/P Gauge • T/P stations Water volume variation : *FWS(j) • Seasonal fluctuations of water storage in the Ob river basin from satellite altimetry and SSM/I measurements • F. Frappart (1), N. Mognard (1),J. L’Hermitte (2), S. Biancamaria (1), B. Legrésy (1), A. Cazenave (1) • LEGOS, UMR 5566 (CNRS/CNES/IRD/UPS), OMP, 18 Av. Edouard Belin, Toulouse (France) • CESBIO, UMR 5126 (CNRS/CNES/IRD/UPS), OMP, 18 Av. Edouard Belin, Toulouse (France) • corresponding author: frederic.frappart@legos.cnes.fr Abstract:Can we monitor the evolution of Central Siberia wetlands in the context of global warming?Remote sensing offers new opportunities to monitor and better understand hydrological cycle of major river basins. Satellite radar altimetry is currently used to monitor the water level of large lakes, rivers, floodplains and wetlands, while satellite imagery (microwave and visible/infrared) can delineate flood extent over large river basins. Various studies demonstrate the possibility to combine observations from radar altimeters and satellite imagery to determine spatio-temporal variations of water volume over inundated areas located in large river basins [Frappart et al., 2005; Frappart et al., in revision]. We apply a similar method to estimate surface water volume variations over the Ob river basin for twelve years of Topex/Poseidon, ERS-2 and ENVISAT altimeters and Special Sensor Microwave/Imager (SSM/I) data. The Ob basin: One of the largest rivers in the Arctic. Total drainage area ~ 2 975 000 km² Length ~ 3650 km 4% to 10% underlain by permafrost [Yang et al., 2004] Delineation of the fooded zones: Data sets: satellite passive microwave brightness temperature measurements at 19 and 37 GHz from Special Sensor Microwave/Imager (SSM/I) from 1988 to 2005 Fraction of Water Surface (FWS) from Fily et al. [2003] Microwave emissivities are primarily affected by the percentage of water bodies in the observed cell Secondary effect soil moisture in the first few cm and vegetation TBP = eP x t x Ts + (1-eP) x t x Tad + Tau t: atm. transmission; Ts: land surface temperature; Tad: downward atmospheric contribution; Tau: upward atmospheric contribution eV = a x eH + b = ew x FWS + edry x (1-FWS) FWS = (e37H-edry)/(ew-edry) FWS: combination of different contributions: Surface-water bodies, saturated wetlands, swamps, marshes, ferns and to a lesser degree to soil moisture in the first few cm Identification of the flooded zones: threshold method For each pixel : If FWS > 0.15, the pixel is considered inundated Water level time series : T/P from cycle 3 to 460 10/13/1992 to 03/20/2005 Water level maps: Linear interpolation of water levels obtained from each altimetric station over the inundation map derived from SSM/I measurements. • Conclusions: • Densification of the altimetric using in tandem T/P and ERS-2, T/P (new orbit) and ENVISAT RA-2 • Estimation of water volume variations for 1992-2005 • Application the floodplains of Irtysh and middle Ob rivers • Increase of water volume variations correlated with the increase of Artic river discharges to the Artic ocean? References: Fily et al., 2003. A simple retrieval method for land surface temperature and fraction of water surface determination from satellite microwave brightness temperatures in sub-arctic areas, Remote Sens. Env., 85(3), 328-338. Frappart et al., 2005. Floodplain water storage in the Negro River basin estimated from microwave remote sensing of inundation area and water levels, Remote Sens. Env., 99(4), 387-399. Frappart et al., in revision. Water volume change in the lower Mekong from satellite altimetry and imagery data, Geophys. J. Int. Kouraev et al., 2004. Ob' river discharge from TOPEX/Poseidon satellite altimetry (1992–2002), Remote Sens. Env., 93(1-2), 238-245. Yang et al., 2004. Discharges characteristics and changes over the Ob watershed, J. Hydromet., 5, 595-610.