Download

1 / 43
770 likes | 2.9k Vues
Sailplane climb performance and airfoil characteristics. L.M.M. Boermans TU Delft, The Netherlands. Kernploeg dag 24 Januari 2009. A d , Faculty of Aerospace Engineering. . Presentation Layout:. Velocity distributions in thermals Characteristics of typical airfoils Dynamic behavior

E N D
Sailplane climb performance and airfoil characteristics L.M.M. Boermans TU Delft, The Netherlands Kernploeg dag 24 Januari 2009 Ad, Faculty of Aerospace Engineering.
Presentation Layout: • Velocity distributions in thermals • Characteristics of typical airfoils • Dynamic behavior • Results in measured gusts • Conclusions • How to fly existing sailplanes in turbulent thermals
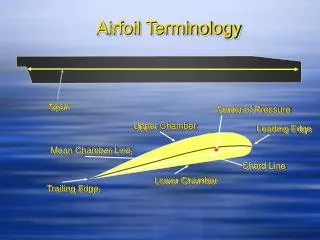
Angle of attack and vane angle Due to curvature of the flow in front of the airfoil the angle indicated by the vane differs from the angle of attack. This has been calibrated in the windtunnel.
Characteristics of typical airfoil For explanation see next sheet.
Characteristics of typical airfoil Consider the lift and drag curves at 20 degrees flap deflection in the previous sheet. When the angle of attack increases from 0 to 2.5 degrees, the flow starts to separate from the end of the flap and the drag starts to increase. When the angle of attack increases from 2.5 to 5.5 degrees, transition moves from 65% chord to 20% chord and separation moves forward to the beginning of the flap (85% chord). The loss of lift at the back is com-pensated by the gain in lift on the forward part of the airfoil (design goal). When the angle of attack increases from 5.5 to 20 degrees, transition moves forward from 20% chord to the leading edge and separation moves forward from 85% chord to 20% chord. At the same time the lift first increases up to the maximum lift coefficient and then decreases. A loss of lift instead of a plateau, shown in the next sheet, causes bad handling characteristics in thermals.
Gust load factor n If the lift curve slope (change of lift with angle of attack) is zero (in plateau), there is no vertical acceleration i.e. no change in vertical movement. This relation is derived for horizontal flight, i.e. no sink rate.
where Equation of motion This is the general expression for the vertical acceleration. The change of angle of attack is equal to the difference between the gust speed and the sink rate, divided by the flight speed. The first term at the right hand side is due to the change in lift (essential) and the 3 remaining terms are due to the change in drag (negligible). The first term at the right hand side is equal to the acceleration on the previous sheet when the sink rate is zero.
Measured gust distribution, T=30sTypical airfoil, flight speed at CL=1.2
Measured gust distribution, T=30sTypical airfoil, flight speed at CL=1.3
Measured gust distribution, T=30sTypical airfoil, flight speed at CL=1.4
Loss of altitude after T=30s Typical airfoil, CL=1.2 – 1.4
Measured gust distribution, T=30sNew airfoil, flight speed at CL=1.4
Measured gust distribution, T=30s Typical and new airfoil Trajectory Loss of altitude at 30s Trajectory in 30s of typical and new airfoil flight speed at Cl=1.4 Altitude loss after 30s depends on Cl (alfa-start) i.e. flight speed.
Measured gust distribution, T=60s Typical and new airfoil Trajectory Loss of altitude at 60s Trajectory in 60s of typical and new airfoil flight speed at Cl=1.4 Altitude loss after 60s depends on Cl (alfa-start) i.e. flight speed.
Measured gust distribution, T=120s Typical and new airfoil Trajectory Loss of altitude at 120s Trajectory in 120s of typical and new air-foil, flight speed at Cl=1.4 Altitude loss after 120s depends on Cl (alfa-start) i.e. flight speed.
Comparison of performance • At low speed, profile drag contributes 25% to total drag, hence a profile drag reduction of 10% means a total drag reduction of 2.5%. At a sink speed of 0.8m/s in a 35 degr. turn this corres-ponds to a reduction in sink speed of only 0.02 m/s. • A slight gradient instead of a plateau in the lift curve reduces the sink speed (i.e. increases the climb speed) in the measured 30s, 60s and 120s vertical velocity distributions up to about 0.5 m/s. • This shows that in dynamic thermal flight conditions the lift properties are far more important than the drag properties.
Conclusions • Current sailplane airfoils with flaps have a plateau in the lift curve. • Flying in this plateau generates no lifting-up effect in upgusts, and flying below this plateau generates a pushing-down effect in downgusts; in total the climb performance deteriorate. • New airfoils have been designed that have a slight positive gradient instead of a plateau in the lift curve. • This slight positive lift gradient appreciably improves the climb performance.
How to fly existing sailplanes in turbulent thermals ? • The mean vertical air velocity in a thermal determines the steady climb rate of the sailplane. • The variations of the vertical air velocity and shape of the lift curve determine the dynamic behavior of the sailplane. • If the angle of attack increases due to an upgust and the lift increases, the sailplane is lifted up. • If the angle of attack decreases due to a downgust and the lift decreases, the sailplane is pushed down. • If the angle of attack changes due to up- or downgusts and the lift does not change, the sailplane persists in its movement.
LS-3, DG-200, DG-400, PIK-20 No problem.
LS-8, ASW-28 No problem. Discus 1 and 2 Airfoils unknown.
DG-800, ASH-26, ASW-27, ASG-29, Ventus-2 Problems.
Fig. 19 Measured gust distribution, T=30s Typical and new airfoil Trajectory Loss of altitude at 30s Trajectory in 30s of typical and new airfoil flight speed at Cl=1.4 Altitude loss after 30s depends on Cl (alfa-start) i.e. flight speed.
Trajectory at measured gust distribution, T=30s Typical airfoil is not lifted up in upgusts and pushed down in downgusts. New airfoil is lifted up in upgusts but less than pushed down in downgusts. Typical airfoil is lifted up in up-gusts and not pushed down in downgusts. New airfoil is lifted up in upgusts but less than pushed down in downgusts.
Typical airfoil and new airfoil (30s case) 3 4 2 3 1 1 4 2 84 95 90 82 81.5 86 86 83.5 86 86 90 95 2 Altitude loss after 30s depends on Cl (alfa-nul) i.e. flight speed.
Estimation of climb rate, typical airfoil • Alfa = 2.5 degr. (start of plateau) Thermal air velocity 3.8 m/s (ASW-19 climbed 3m/s in Steady rate of sink - 0.8 m/s tests, rate of sink -0.8m/s) Dynamic rate of sink 19m in 30 s - 0.63 m/s Climb rate 2.37 m/s • Alfa = 7.5 degr. (end of plateau) Thermal air velocity 3.8 m/s Steady rate of sink (estimated) - 1.6 m/s Dynamic rate of climb 12m in 30 s 0.4 m/s Climb rate 2.6 m/s
How to fly existing sailplanes in turbulent thermals ? • That depends primarily on the shape of the lift curve. • There is no problem for older sailplanes without and with flaps, except in those cases that the maximum lift is constant over several degrees (DG-100, Astir, ASW-19X, ASW-24). Stay away from that maximum lift plateau by flying at a lower lift coefficient i.e. faster. • There is no problem for recent Standard Class sailplanes LS-8 and ASW-28. Discus 1 and 2 airfoils are unknown.
All recent sailplanes with flaps (ASW-22, ASH-25, ASH-26, ASW-27, ASG-29, Ventus-2, DG-800) have a plateau in the lift curve at flap deflections for climbing. For Nimbus versions the airfoils are unknown but probably similar. Stay away from this plateau by flying at a lower lift coefficient i.e. faster. • What about trying to fly slower, at the end of the plateau? Since Cl at the worst situation (start of plateau) and best situation (end of plateau) is the same, the flight speed is the same, see speed scale for typical airfoil in fig. 39. The speed margin for improved climb rate at the end of plateau is extremely small and close to stall, hence probably impossible to apply in turbulent thermals. Try it yourself, carefully!