Download
1 / 9
90 likes | 123 Vues
Trade Nivesh Investment Advisor is a leading platform for Indian Stock Market trading and here you will get the best quality services like equity and commodity. So must try this advisory for the financial trading.

E N D
COMMODITY WEEKLY REPORT 9-13 July 2018 Trade House 426 Alok Nagar, Kanadia Main Road Near Bangali Square Indore-452001 (M.P.) India Mobile :+91-9039261444 E-mail:info@tradenivesh.in 16thAPR-20th APR
COMMODITIES PREVIOUS WEEKS VALUE CHANGED MCX WEEK HIGH WEEK LOW % CHANGED GOLD (AUG.) 30737 30244 -493 -1.59% SILVER (SEP.) 40050 38560 -1490 -3.71% CRUDE OIL (JULY) 5173 4971 -202 -4.59% NATURAL GAS (JULY) 183.5 175.7 -7.8 -3.77% COPPER ( JULY) 464 442 -22 -4.66% NICKEL (JJULY) 1020 954.1 -65.9 -7.87% LEAD (JULY) 166.75 159.05 -7.7 -4.71% ZINC (JULY) 199.85 185.35 -14.5 -6.61% ALUMINIUM (JULY) 147.5 143.1 -4.4 -3.21% 16thAPR-20th APR
GOLD (AUG.) GOLD (AUG.) LEVEL TGT-1 TGT-2 STOP LOSS WEEKLY WEEKLY 30490 30690 30990 BUY ON DIPS 30190 OPEN 31040 R2 31295.50 31200 31450 SELL ON RISE 31000 30800 HIGH 30737 R1 31361.00 LOW 30244 Pivot 30802.50 CLOSE 31189 S1 30868.00 CHANGE -149 S2 30309.50 % CHANGE -0.48% FUNDAMENTAL VIEW:-Precious metal remains lower After Jobs Report The gold was held back by a mixed jobs report. The U.S. added more jobs than expected in June, indicating a strengthening economy. On Friday Gold prices remained lower as the U.S. dollar weakened and U.S. trade tariffs against China went into effect. Trade conflict between America and China the two biggest economies in the world began in force on Friday. In the coming weeks with more tariffs expected. Precious metal becomes more expensive for holders of other currencies when the dollar step-up and cheaper when it step-down . TECHNICAL VIEW:-MCX Gold last week showed sideways movement and close around its major resistance level of 30800. For upcoming session if it breaks this level then it may take quite recovery from lower level and price can test its next resistance of 31300. On lower side it has crucial support of 30500 and after that 30100 will act as a next important support level and it can also continue with its bearish trend towards next support level i.e. 30000. 16thAPR-20th APR
SILVER (SEP.) SILVER(SEP.) LEVEL TGT-1 TGT-2 STOP LOSS WEEKLY WEEKLY 39200 39800 40600 BUY ON DIPS 38200 OPEN 39056 41600 41000 40200 42600 SELLL ON RISE R2 40844.00 HIGH 40050 R1 40148.00 LOW 38560 Pivot 39354.00 CLOSE 39750 S1 38658.00 CHANGE -694 S2 37864.00 % CHANGE -1.78% FUNDAMENTAL VIEW:-Precious metal remains lower After Jobs Report The Silver was also held back by a mixed jobs report. The U.S. added more jobs than expected in June, indicating a strengthening economy. On Friday Gold prices remained lower as the U.S. dol- lar weakened and U.S. trade tariffs against China went into effect. Trade conflict between America and China the two biggest economies in the world began in force on Friday. In the coming weeks with more tariffs expected. Precious metal becomes more expensive for holders of other currencies when the dollar step-up and cheaper when it step-down . TECHNICAL VIEW:-MCX Silver last week was volatile due to its expiry. For upcoming trading session it may give some lower side movement and test its lower channel line i.e. 39900 levels and if price breaks this key line then it will continue with down trend and test next support of 38600. On upward side it has major resistance level of 40200 and if it breaks and maintains above this level then it settles on higher side as well as take recovery up to its upper key line of 40900 levels. 16thAPR-20th APR
CRUDE (JULY CRUDE (JULY) LEVEL TGT-1 TGT-2 STOP LOSS WEEKLY WEEKLY WEEKLY WEEKLY 4820 4920 4670 BUY ON DIPS 5020 OPEN 5036 5239.75 R2 5090 4990 4250 SELL ON RISE 4890 HIGH 5173 5104.50 R1 LOW 4971 5037.75 Pivot CLOSE 4971 4902.50 S1 CHANGE 65 4835.75 S2 % CHANGE 1.29% FUNDAMENTAL VIEW:-Oil Prices Settle Higher but Can't Avoid Weekly Loss Despite data showing a ramp up in the number of U.S. oil rigs, signaling a potential expansion in domestic crude output, crude oil prices settled higher Friday. Oil prices were supported, however, by ongoing bets on a shortage in global crude supplies amid rising oil demand, the potential for a larger drop in Iranian crude ex- ports – amid looming U.S. sanctions – and ongoing challenges in Venezuela's energy industry. Assumptions for a shortage in global crude supplies come against the backdrop of rising Russian and Saudi output. Oil prices posted a weekly loss after suffering a hefty sell-off Thurs- day, when U.S. crude supplies unexpected rose as imports surged. TECHNICAL VIEW:-MCX Crude oil last week still showed sideways to bullish movement but unable to breaches its upper key line of 5180 and settles below this level. For upcoming week if it breaks 5180 level then we expect for more bullish movement up to next re- sistance of 5250. On lower side it has important support level of 4900 and if price sustains below this level then if will take correction to- wards next support i.e. 4800 levels and after that it continues with down trend. 16thAPR-20th APR
COPPER (AUG) COPPER (AUG) LEVEL TGT-1 TGT-2 STOP LOSS WEEKLY WEEKLY BUY ON DIPS 440 450 415 430 OPEN 451.7 469.28 R2 SELL ON RISE 440 430 465 450 HIGH 464 452.55 R1 LOW 442 447.28 Pivot CLOSE 431.4 430.55 S1 CHANGE 20.3 425.28 S2 % CHANGE 4.49% FUNDAMENTAL VIEW:-In the base metals zinc finds support; nickel dips below $14k/t Mcx Nickel prices on the London Metal Exchange fell by 1.7% at the close of trading on Friday July 6, ending the week more than 4% lower while ongoing macroeconomic pres- sure continues to hinder the complex. Nickel prices continued to suffer against a backdrop of falling LME inventory. Total LME nickel stocks are at their lowest since 2014; this is because nickel still has a bullish fundamental backdrop. The market deficit, falling global stocks level and robust stainless steel demand from China. TECHNICAL VIEW:-MCX Copper last week showed strong down ward side movement and close around its lower key line i.e. 430 levels For upcoming session if it breaches this level then we expect more downside movement and price test next support level of 420. On higher side it has strong resistance level of 440 and if it maintains above this level then it push for some recovery from lower levels and price test next important resistance level of 450. 16thAPR-20th APR
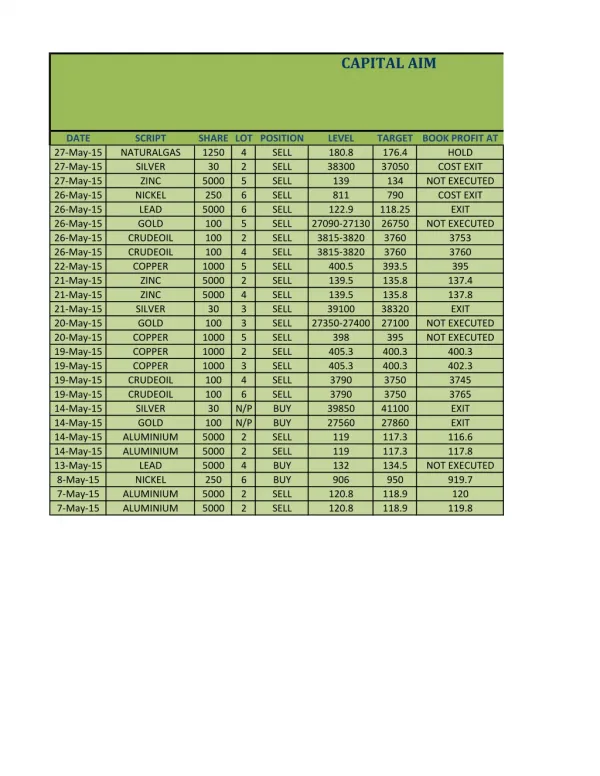
STATUS OF OUR LAST WEEKLY RECOMMENDATIONS (18-22 JUNE 2018) PROFIT/LOSS STATUS RECOMMENDATIONS BUY GOLD BUY ON DIPS 30950 TGT 31150,31350 SL BELOW 30700 -25000 SL TRIGGERED SELL GOLD BELOW 31200TGT-31000,30800 SL ABOVE-31450 40000 2nd TGT ACHIVED BUY SILVER BY ON DIPS 40100 TGT40600,41200 SL BELOW 39400 -8700 CLOSED@39810 SELL SILVER BELOW 38100 TGT-37800-37500 SL ABOVE-38500 0 NOT EXEUTED BUY CRUDEOIL BUY ON DIPS 4350 TGT 4450,4550 SL BELOW 4200 20000 2nd TGT CRUDEOIL SELL ON RISE 4600 TGT 4500,4400SL ABOVE 4750 -7000 CLOSED@4670 BUY COPPER BUY ON DIPS 460 TGT 470,480 SL BELOW 445 -5500 NOT EXEUTED COPPER SELL ON RISE 480 TGT 470,460 SL ABOVE 495 0 NOT EXEUTED TOTAL P&L 6300 58500 16thAPR-20th APR
ECONOMIC CALENDER Time Cur. Event Actual Forecast Previous Monday, July 9, 2018 USD FOMC Member Kashkari Speaks 18:40 Tuesday, July 10, 2018 Wednesday, July 11, 2018 USD -4.500M API Weekly Crude Oil Stock 2:00 18:00 USD 0.20% 0.50% PPI (MoM) (Jun) Crude Oil Inventories Cushing Crude Oil Inventories 10-Year Note Auction 18:00 USD 1.245M 20:00 USD -2.113M 20:00 USD 2.96% 22:30 Thursday, July 12, 2018 USD FOMC Member Williams Speaks 2:00 13:30 USD 0.20% 0.20% Core CPI (MoM) (Jun) CPI (MoM) (Jun) FOMC Member Kashkari Speaks Initial Jobless Claims FOMC Member Harker Speaks Federal Budget Balance (Jun) 18:00 USD 0.20% 0.20% 18:00 USD 18:00 USD 225K 231K 18:00 USD 21:45 USD -144.0B -147.0B 23:30 Friday, July 13, 2018 USD FOMC Member Kashkari Speaks 5:30 USD 0.20% 0.60% Import Price Index (MoM) (Jun) 18:00 USD 98.3 98.2 Michigan Consumer Sentiment (Jul) 19:30 USD FOMC Member Bostic Speaks 22:00 USD 858 U.S. Baker Hughes Oil Rig Count 22:30 16thAPR-20th APR
DISCLAIMER This document is solely for the personal information of the recipient, and must not be singularly used as the basis of any investment decision. Nothing in this document should be construed as investment or financial advice. Each recipi- ent of this document should make such investigations as they deem necessary to arrive at an independent evaluation of an investment in the securities of the companies referred to in this document including the merits and risks in- volved, and should consult their own advisors to determine the merits and risks of such an investment. Reports based on technical and derivative analysis center on studying charts of a stock's price movement, outstanding positions and trading volume. The information in this document has been printed on the basis of publicly available in- formation, internal data and other reliable sources believed to be true, but we do not represent that it is accurate or complete and it should not be relied on as such, as this document is for general guidance only. Trade Nivesh shall not be in any way responsible for any loss or damage that may arise to any person from any inadvertent error in the infor- mation contained in this report. Trade Nivesh has not independently verified all the information contained within this document. Accordingly, we cannot testify, nor make any representation or warranty, express or implied, to the accura- cy, contents or data contained within this document. While Trade Nivesh endeavors to update on a reasonable basis the information discussed in this material, there may be regulatory, compliance, or other reasons that prevent us from doing so. Investment in equity & Commodity market has its own risks. We Trade Nivesh shall not be liable or responsible for any loss or damage that may arise from the use of this information. 16thAPR-20th APR