Download

1 / 50
500 likes | 1.74k Vues
All the evidence for Climate Change recently updated and presented by Environmentalist Jerome Baddley at a meeting of Transition Belper on 1st September 2015

E N D
Who are NetPositive • Social Enterprise • Any profit reinvested in carbon and reduction programmes • Consultancy • Surveys • Environmental Management • Team committed for last 10 years to supporting businesses, organisations and communities to make a positive impact
How do we do it? • Strategic organisation • Chair: Chamber of Commerce Sustainability forum • Chair: Local Enterprise Partnership- Low carbon sector • Chair: Sustainable Public Procurement group, • Author of Nottingham City Energy and Carbon Strategy etc • A practical organisation • Run the Investors in the Environment network, innovation and accreditations scheme with SMEs, investment reports. • Working in partnership • Key academic partnership with NTU- low carbon skills gap, • Key institutions eg Health, Food, Regulators, Local Govt.
CO2 equivalent 2014- 481ppm, CO2 397ppm www.esrl.noaa.gov/gmd/aggi/aggi.html
Current CO2 position • The AGGI in 2014-warming up by 36% since 1990. • CO2equivalents, in 2014- 481 ppm, 397 is CO2 . The rest comes from other gases. • IPCC suggests a constant concentration of CO2 alone at 550 ppm would lead to an average increase in Earth’s temperature of ~3°C.
Fossil furl extraction responsible fro 33% methane emissions
Methane • Methane C33x Global Warming potential of CO2 • Human-related sources create the majority of methane emissions, accounting for 64% of the total.1 • Fossil Fuel extraction responsible for 33% of anthropogenic methane. • US Fracking grew on average 45% pa from 2005-10. • Global methane emissions started to grow again at the same time. Some also potentially from permafrost melt.
US proposes to cut methane emissions from oil and gas extraction by 40-45% on 2012 by 2025 http://www.latimes.com/business/la-fi-0819-obama-epa-20150818-story.html Shale gas stats http://www.statista.com/statistics/183740/shale-gas-production-in-the-united-states-since-1999 CH4 Stats http://www.esrl.noaa.gov/gmd/aggi/aggi.html
Of 136 year July 2015 hottest on record globally 0.81oC increase in land and sea temperatures
Locked into 1.5oC • Possibly around 1.5°C of warming is locked into the system, for current CO2 levels. It takes time for the planet to warm. large-scale carbon drawdown could reduce levels over decades. • We do need to be planning for adaptation to climate change now. • Over the next decades, the social, economic, military, migration and food inflationary impacts as well as the weather.
Current state of play “Arctic sea ice is undergoing a striking, closely monitored, and highly publicized decline.” • https://scripps.ucsd.edu/news/research-highlight-arctic-sea-ice-loss-likely-be-reversible ....If global warming does soon melt all the Arctic sea ice, at least we can expect to get it back if we somehow manage to cool the planet back down again... • However IPCC: “Surface temperatures will remain approximately constant at elevated levels for many centuries after a complete cessation of net anthropogenic CO2 emissions” https://www.ipcc.ch/pdf/assessment-report/ar5/syr/AR5_SYR_FINAL_SPM.pdf
Militarisation of the Arctic http://www.military.com/daily-news/2015/03/12/us-lawmakers-russias-military-build-up-in-the-arctic.html#.VeHZki-uSjQ.mailto Russia adding four new combat brigades in the Arctic, building 13 new airfields, conducting long-range air patrols off Alaskan coast. An assessment by the Navy's Task Force Climate Change determined rate of melting increased. Navy planners anticipate needing to operate there to a much greater extent by the middle of the 2020s instead of the 2030s • Securing oil reserves and shipping routes • Obama given drilling permission to Shell!
Already at 54% capacity The world's seven billion people are appropriating 54 percent of all the accessible freshwater contained in rivers, lakes and underground aquifers. Source: WWAP
Health • Lancet- Climate Change is the Greatest risk to Public Health of the 21st century • BMJ 2014- Climate Change a ‘health emergency’ • 60,000 excess deaths per year from fossil fuel vehicle pollution, similar in scale to smoking • NHS responsible for 5% for UK road traffic, 2,000 excess deaths. • The way healthcare is delivered should not kill people! • Lobbying for fossil free sustainable healthcare.
EXPECTED REMAINING RESOURCE • Limited resource, but more than enough to destroy the planet several time over. • Very high oil prices make polluting exploration profitable. High prices destroy economies and demand, making fossil fuels last longer. • Low prices favour coal, damage investment in renewable, efficiency, shale and tar sands. • Mutually Assured Destruction-through fossil fuelled economic growth? • Solar, wind etc + efficiency, after investment natural resource stays same price-Free. That is Energy Security!
Leave it in the Ground • “No more than one-third of proven reserves of fossil fuels can be consumed prior to 2050 if the world is to achieve the 2 °C goal” -IEA World Energy Outlook (50% chance of 2oC) • Did not include US shale oil • www.carbontracker.org - based on 80% chance of avoiding 2oC only 20% could be burnt. • Lobbying for disinvestment-economic and health arguments. Stranded assets. Carbon Bubble. • We need to individually lobby and disinvest.
IEA position 2013 • Fossil fuels = 80% of global energy demand. Even if current policy commitments and pledges, global energy demand in 2035 is projected to rise by 40% – 75% fossil fuels. • Over past 20yrs, global share of power generation from non fossil sources has decreased from 37% (in 1990) to 33% (in 2010); • By contrast, share of coal-fired power generation has risen from 37% to 42%. • A revolution in global commitment is required in Paris.
Some success on energy! Preliminary IEA data indicate Global CO2 emissions from the energy sector stalled in 2014. First time in 40 years, halt or reduction in emissions, not tied to an economic downturn. http://www.iea.org/newsroomandevents/news/2015/march/global-energy-related-emissions-of-carbon-dioxide-stalled-in-2014.html
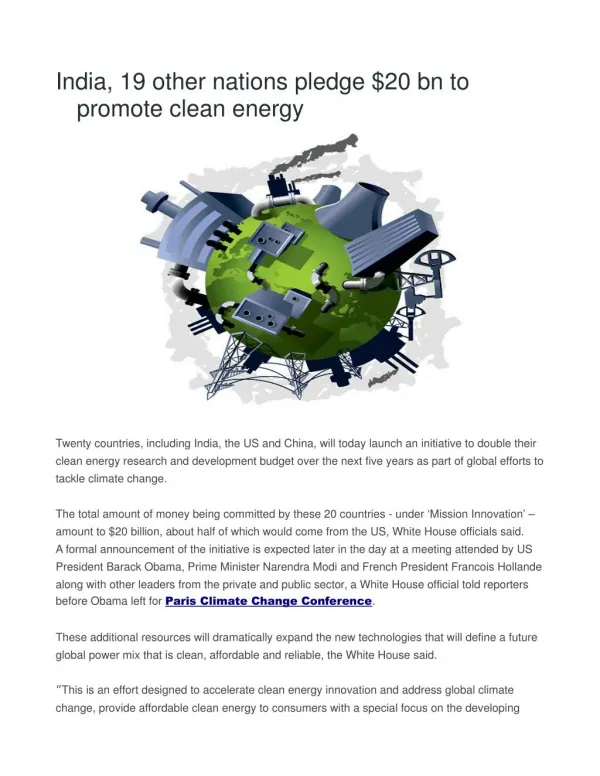
US and China • https://www.whitehouse.gov/blog/2014/11/12/us-and-china-just-announced-important-new-actions-reduce-carbon-pollution
However in the UK! While leading globally on the Climate Change Act, Conservatives rolled back 10 key programmes. • Scrapping support for onshore wind • Scrapping support for Solar farms • Early end to Feed in Tariffs- Govt has admits would only save 50p a year on bills. • Scrapping support for coal shift to Biomass • Killing the Green Deal- withno replacement • Selling off the Green Investment Bank • Watering down green car tax incentives • Giving up on 2016 zero carbon homes target • Green tax target- no increases in green taxes. • Threatening Swansea tidal scheme.
‘The size and performance of the UK Low Carbon Economy’ (2010-2013) March 2015. • 11,550 UK businesses directly engaged in low carbon economy 2013 • 1.5% of all UK jobs are in the low carbon economy • £121.7bn of sales generated directly and in supply chain • The direct low carbon economy generated £26.2bn in GVA in 2013
What does that mean? • With supply chain sales are double UK's auto manufacturing industry. • GVA about 5x aerospace, 2.5xPharma, almost 2xChemicals industry and equivalent to Food and Drink. • GVA generated by the low carbon sector increases to £44.9bn with supply chain • Nationally employment in the low carbon sector grew 12 per cent from 2010 to 2013. • 2x likely to export than any other sector
While • Allowing fracking to in SSSIs and have planning fast tracked • Subsidising Nuclear power • For now allowing more expensive offshore wind. • UK has the most energy inefficient housing stock in the UK • Some of the worst urban air quality • Best wind resource • Best tidal resource • Huge potential to export expertise.
Smarter society? • Technology improvements are helping us use less, however..... • Data centres now consume 6.2GW in the UK • DRAX generates 6.9GW! • Watching an online film could cause up to 10kg CO2 emissions!!! Same as driving 80 miles in a car. Maybe better to watch a film in the cinema! • ICT will soon overtake global aviation as a cause of 2% of global emissions. • Demand low carbon data from your provider
Global awareness • To meet the increasing demand from a growing population we will need to produce more food in the next 40 years than has been produced in the previous 8,000 years. • Jason Clay, Senior Vice President WWF
Food UK and sea level rise • http://geology.com/sea-level-rise IPCC-maybe 0.8m by 2100, though more and sooner possible. Salt ingress and sporadic flooding before inundation.
Coastal Change in East Anglia: Results from the RegIS ProjectRobert NichollsFlood Hazard Research Centre, Middlesex University2050 “Given the importance of this area to UK arable agriculture this has national implications” http://www.tyndall.ac.uk/sites/default/files/Full_Report.pdf
Food, Water, Fuel and Energy • Interlocking challenges • Water and land needed for food • Fertile land and water needed for wood, oil and sugar for biofuels • Ethanol use the equivalent of 1 loaf a mile! • Increasing climate instability and rising sea levels undermining fertile land and food production. Food will be the greatest challenge, learn how to grow, support local and UK agriculture. Minimise waste.
Water, Food, Unrest, Migration • “Before the Syrian uprising that began in 2011, the greater Fertile Crescent experienced the most severe drought in the instrumental record. • For Syria, a country marked by poor governance and unsustainable agricultural and environmental policies, the drought had a catalytic effect, contributing to political unrest” • http://www.pnas.org/content/112/11/3241 Climate change and resulting water and food impacts, are already contributing to unrest and migration
What can we do? • Start selfishly, start locally. Protect your family, your future and your services. Step up. • Purchase and consume mindfully and positively china’s emission are your products. • If it works shout about it. If you find something out that amazes you, talk about it. If it is wrong campaign against it. • You cannot wait for someone else to fix your home, your community, your world. • There is a business case and a market for sustainability, start a business, offer a solution. • The time to get serious is NOW
Thank you Jerome Baddley CEnv MIEMA Sustainability Services Manager Jerome.b@nottenergy.com