Download
1 / 55
550 likes | 568 Vues
Knowing about the latest Facebook ad stats indeed makes you an expert and gives a positive kickstart to your PPC results. PPC and Facebook resources provides a baseline for testing and a real eye-opener as you grasp the best practice.

E N D
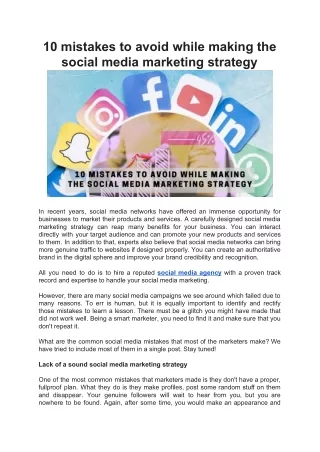
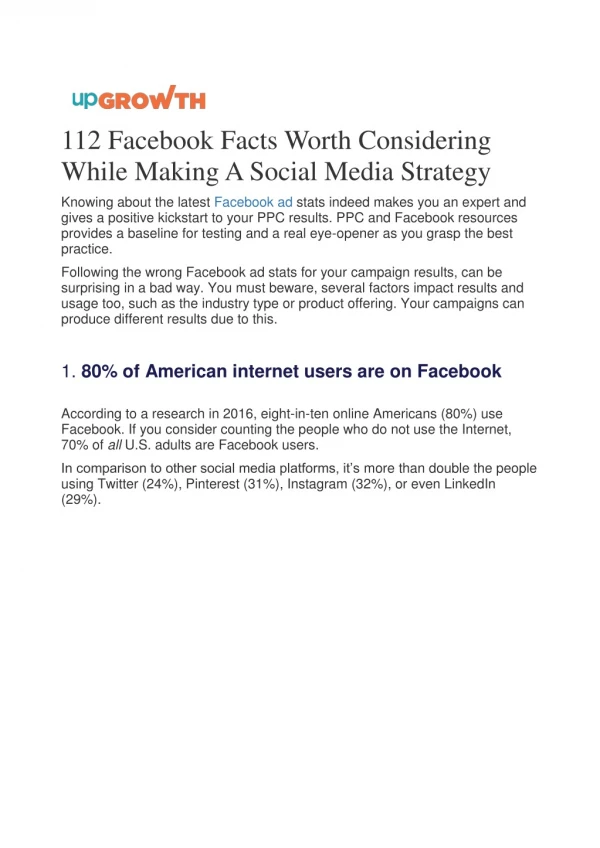
112 Facebook Facts Worth Considering While Making A Social Media Strategy Knowing about the latest Facebook ad stats indeed makes you an expert and gives a positive kickstart to your PPC results. PPC and Facebook resources provides a baseline for testing and a real eye-opener as you grasp the best practice. Following the wrong Facebook ad stats for your campaign results, can be surprising in a bad way. You must beware, several factors impact results and usage too, such as the industry type or product offering. Your campaigns can produce different results due to this. 1. 80% of American internet users are on Facebook According to a research in 2016, eight-in-ten online Americans (80%) use Facebook. If you consider counting the people who do not use the Internet, 70% of all U.S. adults are Facebook users. In comparison to other social media platforms, it’s more than double the people using Twitter (24%), Pinterest (31%), Instagram (32%), or even LinkedIn (29%).
About 80% of people use Facebook actively as shown in the above image. 2. Over 70% of Facebook users visit the platform daily According to another report, 76% of Facebook users claim, they visit the site daily, 55% visit it several times in a day, 22% visit once in a day.
The daily active user rate is higher than other social media sites: Instagram (51%), Twitter (42%), LinkedIn (18%), and Pinterest (25%). 3. Facebook is the most used social media platform Facebook has remained the most used social media platform amongst all age groups with 65% of them using Facebook,reports claim. Among 12-24-year-olds, it is overtaken by Snapchat (72%) with Instagram not far away (66%). If you want to ensure that you reach the largest number of people, combine Facebook ads with Instagram and Twitter ads. Don’t forget about Snapchat and LinkedIn too. 4.Almost 30% of the world’s Population uses Facebook
Statista’s data show world over, about 38.6% of the online population and almost 30% of the total population uses Facebook. 5.Facebook is Google Play’s most downloaded app Google Play celebrated its fifth birthday in March 2017, it listed its most downloaded of all time.
Two of the TOP 5 spots in the ‘most downloaded apps’ list belong to Facebook. 6. Facebook is the sixth-most-valuable company in the world In reference to a list of the world’s TOP 2,000 company, Forbes compiled in May 2017- Facebook is the sixth most valuable publicly traded company in the world. As of current stats, Facebook’s current market value is nearly $407 billion. 7. Users spend 50 minutes/day on Facebook’s platforms
During the first quarter of Facebook, in 2016 earnings, Mark Zuckerberg told: “People around the world spend on average more than 50 minutes a day using Facebook, Instagram and Messenger…and that doesn’t count WhatsApp. In July 2014, the stats declared American users spending 40 minutes per day on Facebook’s, as per TechCrunch. If you desire reaching your target audience across all social platforms, test a combination of Facebook and Instagram ads. 8. 56% of adult users use more than one social media platform Another research’s data shows 90% of people using Instagram, Twitter, LinkedIn or Pinterest, have a Facebook account they’re actively using too. Amongst people who only use one social platform, about 88% indicate – Facebook is one site that they surely use. This implies that the audience you’re trying to engage on Instagram, Twitter, LinkedIn or Pinterest can be effectively reached with Facebook ads. 9. Facebook accounts for 62% of all social logins According to Advertising Age, Facebook accounts for nearly 62% of social logins in 2015 tracked by a company that provides tools for brands and publishers to allow people log into their sites and apps using their Facebook, Google, Twitter, Yahoo or any other accounts.
Facebook is also followed by Google (24%), Twitter (7%), and Yahoo (4%). Facebook and Google are preferences for login in nearly 100% of the websites. Twitter is preferable is about 72% of the sites and Yahoo by 35% of sites. 10. Facebook accounts for 80% of mobile social logins A report by AdvertisingAge told that the lead of Facebook is much more visible when mobile logins are considered. Research has processed 58 million social logins across 700 brands and publisher sites in the 4th quarter 2015. 80% of mobile social logins were attributed to Facebook. 11. 75% Facebook users use it for professional purposes Number of people use the traditionally “personal” social networks (Facebook, Twitter, etc.) for professional purposes, a report of 2017 claims.
75% of respondents use Facebook professionally, almost catching up with 78% of LinkedIn users – a network designed for professional usage.
This graph proves that brands an succeed using their B2B campaigns on Facebook. 12. There are 2.5 trillion posts on Facebook A report from TechCrunch claims, Facebook’s been around since 2004 and the users have made over 2.5 trillion posts till date. Now, you can simply use Facebook’s Promoted Posts to make your messages more visible. 13. Facebook users make 2 billion searches every month If you’re wondering if anyone is using the Facebook’s Search box, some people definitely are. According to TechCrunch reporting in 2016, the average of 2 billion monthly searches was made on Facebook’s platform. 14. Facebook users generate 4 million likes every minute An astounding amount of content is produced on Facebook every minute. According to an infographic by Dealhack, Facebook users generate 4 million likes every minute. In addition, every 60 seconds, – Around 500 new users join Facebook – Nearly 100,000 friend requests are sent – More than 243,000 photos are uploaded on Facebook – Close to 50,000 links are shared on Facebook – About 3,3 million items are shared on Facebook
15.42% millennials can’t last 5 hours without checking Facebook feed According to a study in 2017 by eMarket, nearly 42% of millennial respondents claimed not have lasted five hours without checking their feeds. 16. Monthly, 2.5 billion comments are made on Facebook Pages Data on Facebook shows that in 2015, people left 2.5 million comments on Facebook pages every month. 17. Facebook Reactions have been used 300 billion times According to AdWeek, Facebook Reactions have been around for almost one and a half years. During its first year of availability, the Reactions were used by over 300 billion times.
The love reaction is the most used reaction on Facebook. 18. Facebook is preferred social network for 62% of marketers The Social Media Marketing report 2017, reveals that when asked to select their most important platform, 62% of marketers prefer Facebook, followed by LinkedIn at 16%. Compared to 2016 results, the preference for Facebook increased from 55% to 62% in 2017.
Facebook proving to be the most beloved social media platform. 19. Facebook is the top ad channel for both B2C and B2B marketers A similar report revealed Facebook is the number one choice for 72% of B2C marketers when it comes to social advertising channels. However, for the first time in the history, Facebook has passed LinkedIn as the most important platform for B2B marketers, with 43 marketers naming it their top choice.
20.94% of social marketers use Facebook’s platform Facebook, Twitter, LinkedIn, and Instagram are the prefered four platforms used by social media marketers, with Facebook leading the pack – 94% of
marketers use Facebook, according to the Social Media Marketing Report 2017.
21. 56M+ businesses have a Facebook Business Page A report by Forbes claimed by the end of 2015, over 50 million businesses were using Facebook Business Pages. Now, the number has soared to 65M+ companies. Facebook pages make it easier to reach and engage with large audiences, especially on mobile. 22. The most popular Facebook page has 497,066,390 likes According to a research, the most followed Facebook page is ‘Facebook for Every Phone’, with 497,066,390 likes. The second and third places are held by Facebook (188,000,726 likes) and football sensation Cristiano Ronaldo(121,273,970 likes)
23. 49% users like a Facebook page to support their favorite brands According to Syncapse, 42% of the 2,000 respondents likely “to get a coupon or discount” as one reason they fan a brand on Facebook. The top reason is “to support the brand I like.” If you want to get more likes to your page, you could try target the friends of your fans. People are more likely to like pages also liked by their friends.
24. 40% of Facebook users don’t like any branded pages Kentico’s research revealed 2/5 Facebook users do not like any branded pages. When asked how many brands they Like on Facebook, 39% said 1-10, 7% said 11-20, and 6% said 21-30. 40% of the people questioned don’t like any branded Facebook pages. 25. Marketers post to branded Facebook pages 8 times per day Social Media Examiner surveyed social media marketers and found out that on average, they post on a branded Facebook page 8 times per day. 39% of marketers have increased their posting frequency on Facebook over the last year. 15% have decreased their posting frequency. 26. Branded Facebook page posts organically reach only 2% of your fans
As reported by AdWeek, in March 2015, the average Facebook page post reached 2.5% of the page’s fans. This means, 97% of your Facebook page’s fans may not see your post. However, the situation is better for smaller brands. For pages having under 1,000 likes, the avg. organic post reach was between 14%-23%. 27. In 2016, publishers saw a 52% decline in organic reach on Facebook From January 2016 through mid-July 2016, publishers of Facebook Pages experienced a 52% decline in organic reach. This leads to fewer clicks, comments, and shares. 28. An increasing number of companies uses Promoted Posts According to a study in 2015, brands have made an increase in their post promotion on Facebook by 80% from 2013 through to 2015. The graph here just shows how the positive trend has been growing over time. 29. Nearly 5 million business use Facebook for advertising In March 2016, three million companies all over the world used Facebook’s paid ads to reach the target audience, with more than 70% from outside U.S. In April 2017, the number has soared to 5 million advertisers! Majority of Facebook’s advertisers are small and medium sized businesses. 30. 93% of social marketers regularly use Facebook ads
According to a report recently, a massive 93% of social marketers use Facebook ads regularly and 64% plan to increase their Facebook ads activities. 31. Facebook users watch 8 billion videos per day In November 2015, as per TechCrunch, Facebook climbed to 8 billion video views daily. Even at a mere 3 seconds per view, Facebook generates 760 years of watch time every single day. 32. 500 million people watch Facebook video every day As per RecodeNet, more than around 500 million Facebook users indulge in watching Facebook videos every day. 33. 100 million hours of video are watched on Facebook every day In May Facebook claimed, its users watch more than 100 million hours of video every day. Videos are becoming even more popular as a medium. Therefore, it’s indeed a good idea to test Facebook video ads and A/B test them against any static image ads. 34. Facebook’s average video engagement rate is 6.3% As per eMarketer, Facebook’s native videos have an average engagement rate of 6.3%, compared to 3.2% for YouTube videos and 0.2% for Instagram videos. The above table measures the performance metrics of videos posted and an analysis is made thereof.
35. Most videos posted on Facebook are native to the platform The eMarketer’s study revealed that many brands created video posts native to Facebook. About two-thirds (65%) of brand video posts on Facebook are Facebook native. Around 24% of video posts to the social network are links to YouTube. 36. Facebook video ads have the lowest CPC A report by Kinetic Social in 2015, showed that video ads have the lowest eCPC, with an average eCPC of close to $0.18.
37. 85% of Facebook videos are consumed without sound According to a survey of multiple publishers, about 85 percent of video views happen with the sound off 38. 47% of video campaigns’ value is delivered in first 3 seconds
Facebook analyzed how people reacted with Facebook video campaigns. The data showed that people who watched under three seconds of the video ad create up to 47 percent of the total campaign value. 39. Captioning Facebook videos increases the watch time by 12% Facebook’s tests have shown that captioned video ads increased video view time by an average of 12%. 40. 80% of people don’t like mobile video ads playing sound automatically A research showed that most people (80%) do not like when a Facebook news feed video starts playing automatically with the sound on. 41. Growth of social video ads is slowing down As social video ad spending share saw a continuous increase between the 1st and 4th quarter of 2016, signs show that the growth will be slowing down, according to reports from eMarketer.
42. Facebook live videos are watched 3x longer while they’re live In a media release of 2016, Facebook’s Product Manager wrote that users spend an average of more than 3 times watching a Facebook Live video in comparison to a video that’s no longer live. 43. Facebook’s paying $50+ million to influencers for (live) video use According to WallStreetJournal, Facebook is indeed paying influencers, publishers, and celebrities $2.2M from the total pool of $50+ million to promote Facebook videos, and especially Facebook Live videos. 44. Instagram makes up 20% of Facebook’s mobile ad revenue A report states –Instagram will make up 20% of Facebook’s U.S. mobile revenue in 2017. If you’re already advertising on Facebook’s mobile platform, you could test including Instagram feed in your ad placements.
45. Only 42% of marketers feel like their Facebook efforts are working A report by Social Media Examiner shows that while Facebook advertising stats show a growth trend, many marketers are still unsure whether their Facebook marketing efforts are paying off. When asked whether their Facebook marketing strategy is effective, only 45% of B2C and 37% of B2B social marketers agreed.
46. Facebook’s worldwide ad revenue will increase by 35% YoY in 2017
According to a report in 2017 by eMarketer, Facebook is expected to bring in $36.29 billion in worldwide ad revenues this year. It is up by 35% from 2016. Within the digital display category, Facebook is No. 1 by a wide margin. 47. Facebook’s advertising revenue keeps growing According to CNBC, in THE 1st quarter of 2017, Facebook earned $7.86 billion in advertising revenue, up 51 percent from a year ago. The main factors that have helped Facebook to grow its ad revenue: 1. Increasing ad load — the number of ads on the website 2. Steady user growth 3. Increase in the time spent on Facebook’s platform
48. Facebook’s growth is steady, but slowing down According to predictions, the pace of growth for Facebook’s ad revenue will be markedly lower by 2018 than it was in 2016. eMarketer forecasts 26.5% growth in 2018—less than half the pace of 57.4% increase seen in 2016. 49. 84% of Facebook’s ad revenue comes from mobile ads
According to Facebook’s 2016 4th quarter, Earning’s report, mobile advertising accounts for 84% of its ad revenue. If you’re not yet using Facebook’s mobile ads, it’s time to get started! 50. In 2017, mobile will account for 70% of digital media According to a report on U.S. advertising in 2017, mobile will be the main driver of digital’s growth in 2017, accounting for 70% of digital and more than one- quarter of total media outlays. 51. Facebook’s average revenue per user is $4.73 According to Facebook’s Earning report in 2016, the average revenue per user is $4.73 worldwide. However, it’s a lot higher in the U.S. ($19.81) and also in the EU ($5.86).
52. The average click-through rate (CTR) for Facebook ads is 0.90% The average Facebook ad CTR across all industries is 0.90%. Following is a list of the average click-through rates in specific industries, shared by Wordstream:
1. Apparel – 1.24% 2. Retail – 1.59% 3. B2B – 0.78% 4. Technology – 1.04% 5. Finance & Insurance – 0.56% 53. The average conversion rate for Facebook ads is 9.21% A report by Wordstream revealed that the average conversion rate is highest in the fitness industry (14.29%) and education (13.58%). It’s the lowest in the technology (2.31%) sector.
54. The average CPC for Facebook ads is $0.35 When analyzing the 2016 4th quarter, Facebook ad stats, it was found that the average cost-per-click of Facebook ads is $0.35. In the U.S., the average CPC is $0.26. 55. The average CPC is higher for female audiences On being compared by gender, the CPC tends to be higher when advertising to female audiences, according to research. In the 4th quarter of 2016, the average CPC for female audiences was $0.24 and $0.19 for male target groups.
56. It’s more expensive to advertise to older audience A research also showed that it’s more expensive to be advertising to audiences aged between 45-65+ years, compared to people aged 18-44 years.
Facebook ads CPC segmented by months (image source) It’s cheaper to advertise to younger audiences. 57. The average Facebook ads CPC is lower in summer months According to a research by AdExpreso, Facebook ads CPC in 2016 was highest in October and November. The cheapest months for Facebook advertising in 2016 were June and July. 58. Right-hand column and Desktop ads have the highest CPC In the 3rd quarter of 2016, the average cost-per-clicks across different Facebook ad placements were the following, as per a report: 1. Desktop news feed – $0.32 2. Mobile news feed – $0.19 3. Instagram – $0.60 4. Right-hand column – $0.32 5. Audience network – $0.06 59. The most expensive day to advertise on Facebook is Friday According to AdEspresso’s analysis of Facebook ad costs, the cost-per-click of Facebook ads is highest on Fridays ($0.27), followed by Thursday ($0.25). However, this is a general statistic and the CPC may vary depending on your industry, audience, offer, and many other factors. 60. The cheapest time of day to advertise on Facebook is evening
The cheapest time to advertise on Facebook is shockingly the most popular one – the evening commute. The research showed that the average CPC between 4p.m. and 8p.m. is around $0.23. 61. In one Facebook ad test, mobile outperformed desktop ads by 34% A research ran a Facebook ads experiment where the Desktop ad placement (average CPA $4,625) had a 34% higher cost-per-acquisition compared to Mobile ads (average CPA $3,188). Want to use inbound marketing to boost your marketing efforts? {{cta(‘5d058249-de0d-45b3-bde5-cec3e7b60d2e’)}} 62. The CPC with Page Engagement campaign objective is $0.12 If your goal is to drive clicks at a low cost AdEspresso recommends that you use one of these campaign objectives: 1. Page engagement – avg. CPC $0.03 2. Post engagement – avg. CPC $0.04 3. Link Clicks – avg. CPC $0.12 63. The average cost per action (CPA) for Facebook ads is $18.68 The report by Wordstream does not mention what exactly they meant by cost per action, its sure they meant the cost per conversion or cost per acquisition. As per the report, the average cost per action (CPA) for Facebook ads is $18.68. It’s around three times higher for the technology ($55.21) sector and a lot lower for education ($7.85). 64. The average cost per 1,000 ad impressions (CPM) is $7.1
AdEspresso analyzed plenty of Facebook ad campaigns and found out that the average cost per 1,000 ad impressions is $7.19, and $7.34 for ALL objectives. 65. The average cost-per-like for Page Like campaigns is $0.26 A research by AdEspresso showed that, for campaigns created with the Page Likes objective, the cost-per-like at an average was $0.26 in 2016. It was even lower with Mobile newsfeed ad placement ($0.10). 66. If you want more page likes, advertise on mobile A research also showed that the average cost-per-like is the lowest for mobile Facebook ads. In 2016, the cost-per-like at an average for mobile placement was $0.10, compared to $0.23 for desktop and $0.21 for right-hand column. 67. The average cost per app install for Facebook ads is $1.70 According to an AdEspresso’s research, the cost per app install is highest in the UK, Germany, and the U.S. The average cost per app install for Facebook ads is around $1.70. 68. The average cost per app install is lowest in Audience Network It’s best to advertise your mobile app in Facebook’s mobile newsfeed. A research shows that the cost per app install is lowest for the Audience Network ad placement ($0.62). Cost per app install by placement 69. The average cost per app install is cheapest on Android devices
If you’re not sure which device users to target with your Facebook ads promoting a mobile app, test advertising to Android tablet and smartphone users. It’s more expensive at times to get iPad and iPhone users to download your mobile app, AdEspresso found. Android tablets have the lowest cost per app install. 70. About 69% of Facebook ads link to a landing page AdEspresso’s Facebook research reveals that 69% of all Facebook ads link to a landing page. 20% of ads link to a Facebook page and 11% to the company’s home page. 71. Your CPC increases by 49.82% when ad frequency reaches 2 points Ad frequency is an ad metric on Facebook showing how many times your target audience has seen your Facebook ads on average. AdEspresso found that once your ad frequency reaches 2 people having seen your ad, the average CPC increases by 49.82% and the CTR decreases by 8.91%. Higher ad frequency = Higher costs 72. 1% Lookalike Audience has a lower CPC than 10% Lookalike AdEspresso ran a Facebook ads experiment. They tested 3 different Lookalike Audiences: 1% Lookalike, 5% Lookalike, and 10% Lookalike. The 10% Lookalike Audience had a 70% higher cost-per-conversion than the 1% Lookalike Audience. 73. $5 Per Day on Facebook Ads Can Buy You 9 Page Likes
Buffer tested what advertisers can get for a $5/day ad spend on Facebook. They discovered that you could get 9 page likes at $0.57 per like. 74. A Facebook ad click taking to a B2B site costs $4.01 According to an experiment by Buffer, the average cost per landing page click to a B2B website costs $4.01. However, if you’re able to create highly relevant Facebook ads, this number could be a lot smaller. 75. Reaching 1,000 people with Facebook ads costs $6.35 In one of the experiment’s, Buffer’s team uncovered that reaching an additional 1,000 people with your Facebook ad campaigns will cost $6.00. However, Buffer was targeting a B2B audience in a competitive industry. You can get results by low budgets. 76. $5 boosted post can help to reach 787 people Another key takeaway from Buffer’s Facebook ad experiment is – boosting a Facebook page post for $5 helped them reach 787 people on average Buffer’s advertising costs were really high compared to the industry average. 77. 75% of your Facebook post’s engagement happens in the first 5 hours As per Post Planner’s research, 75% of the engagement you get on your posts happen within the first 5 hours. After that, engagement does die off.
78. 75% of Facebook post’s lifetime impressions happen in 150 minutes A case study by Post Planner showed that 75% of impressions happen in the first 150 minutes after publishing your Facebook post. This means once your Facebook post has been published for 2.5 hours, it may be a good time to boost it for further reach. 79. Your Facebook post’s reach depends on the size of your fanbase According to Socialbakers, the organic reach of Facebook posts depends on the size of your Facebook fanbase. The fewer page likes you have, the more will they see your post in their newsfeed. 80. The best time to post on Facebook is between 12 p.m. and 3 p.m. Buffer looked into the best times to be publishing on various social media platforms. They found out that you could potentially get the highest post engagement when posting between 12 p.m. and 3 p.m. On the weekends, it’s between 12 p.m. and 1 p.m. 81. Most Facebook headlines are 5 words long As per Facebook’s ad copywriting, most marketers prefer to use headlines that are 4-6 words long. 82. The average Facebook ad main copy is 14 words long While analyzing numerous Facebook ads, AdEspresso discovered that the length for ad post text is a mere 14 words.
83. The average Facebook ad link description is 18 words long The Facebook ad link description is longer than the main copy, averaging at 18 words, as reported by AdEspresso. 84. Using a CTA button can lift click-through rates by 2.85 times A research shows that Facebook ads with a call-to-action button can potentially return 2.85 times better results. 85. The most popular Facebook ad call-to-action button is “Learn More” As per AdEspresso, the the widely used Facebook ad CTAs are: 1. Learn More – 34.5% of all ads analyzed 2. Play Game – 30.7% 3. Sign Up – 22.6% 86. According to an experiment, “Download Now” is the best CTA Another ad experiment run on Facebook was where they tested three different call to actions: “Download Now, ”Sign Up “,” and “Learn More.” The goal of their campaign was get people download an eBook. The “Download” CTA outperformed the “Learn More” CTA by 50.6% and the “Sign Up” CTA by 40.4% regarding the cost per lead. 87. Facebook has 1.94 billion monthly active users According to Statista’s experiment in 2017, Facebook has 1.9 billion monthly active users.
The MAU (monthly active users) metric is calculated by counting unique users that have visited a site/app during a period of 30-days 88. More than 820 million people are mobile-only users A report by TechCrunch, at the end of 2015 claims Facebook had 827 million mobile-only users. 89. Nearly 80 million people use Facebook Lite 80 million people are using Facebook Lite globally – a simplified app that brings the essential Facebook experience to budget phones with 2G connections, as reported. This means the potential to reach people is high even in the less-developed countries. 90. 1.7 billion people use WhatsApp and Messenger combined During the 4th quarter in 2016 earnings report, Facebook revealed that appropriately 900 million people are using WhatsApp and 800 million people are using Messenger every month. 91. There are millions of fake Facebook accounts According to CNET (2012), Facebook claimed 8.7 percent or 83.09 million of its user accounts were fake. However, there’s no updated number on this. Facebook’s user base has almost doubled throughout 2012-2017, but it has also taken specific measures to fight the fake accounts. 92. Facebook adds 500,000 new users every day
Facebook ad stats from 2015 showed that every second, 6 new Facebook profiles were created.Hence almost every day, half a million Facebook accounts were created. 93. 75% of male and 83% of female Internet users are on Facebook According to a report by Pew Research Centre in 2016, 75% of male and 83% of female Internet users are on Facebook. That’s a potential audience that you can reach. 77% of 14- to 17-year-olds report using the social media platform. Also, nearly 23% of teen girls used Tumblr and 33% of American teens use Twitter. 94. 71% of teenagers have a Facebook account According to a survey in 2015 by Pew Research Center, 72% teenage boys and 70% teenage girls are Facebook users. 95. Half of all adult Facebook users have more than 200 friends The average number of Facebook friends in 2013 was 338, and the median number of friends 200, Pew Research Centre claims. If you can share content that’s relevant and interesting to your target audience, chances are they’ll give it a like or share, making your Facebook post appear in their friends’ newsfeeds. 96. The average Facebook user has 155 friends The Telegraph reported that female users have more Facebook friends on average than men: 166 compared to 145.