Download
1 / 24
250 likes | 291 Vues
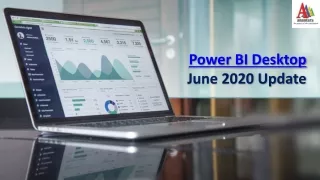
Hereu2019s the complete list of June updates. Anantara is a leading Microsoft Dynamics Partner, Our certified team has vast experience in Implementation, Upgradation, Integration, Customization, Data-Migration & Support on Microsoft Dynamics 365 on-cloud & on-premise.<br><br>To know more about Anantarau2019s Microsoft Dynamics 365 Services Contact us today!<br><br>https://www.anantsol.com/microsoft-dynamics-365-power-bi-services/

E N D
What's new in Power BI Desktop? • Here’s the complete list of June updates: • Reporting • Analytics • Visualizations • Template apps • Modeling • Data connectivity
Reporting • Enhancements to mobile layout authoring • New phone emulator • Updated visualization pane • Support for overlaid visuals • Automatic page refresh is now generally available • Hierarchical slicer is now generally available • New options for expand/collapse icons • Icons now scale with font size • Ability to customize indentation for child items • Supported with AI visuals
Analytics • AI insights are now generally available • Visualizations • Line chart dot formatting options • Radar chart by MAQ Software • ValQ for Modern Visual Planning • Advanced Trellis by xViz • Updates to Gantt chart by xViz • Updates to Cards with States by OKViz
Template apps • Agile HR Analytics • Uber User Data Report • Modeling • Model view enabled for live connect (preview) • Updates to Model view • Data connectivity • Palantir Foundry connector
Reporting • Enhancements to mobile authoring • As the Power BI mobile apps have increasingly been adopted by more and more organizations, we have received feedback asking for more capabilities and improvements for the mobile authoring experience. • We hope that the enhancements introduced in this release will help you more easily build compelling, interactive reports optimized for mobile devices.
Here are the new experiences and capabilities that will help you build mobile-optimized reports: • New phone emulator • Updated visualization pane • Support for overlaid visuals
Automatic page refresh is now generally available • Automatic page refresh: supported in both Pro and Premium. • Change detection measure: only supported in Premium. • Both capabilities are enabled by default with the interval minimums described previously. • Performance analyzer in Desktop • Capacity metrics app
Hierarchical slicer is now generally available • With this release it includes several improvements: • New options for expand/collapse icons. • Icons now scale with font size. • Ability to customize indentation for child items. • Supported with AI visuals.
New options for expand/collapse icons Originally, you only had one option for the expand and collapse icons, which were chevrons: While the chevron icon is still the default option, we’ve now added two new options:
To find these options, select your hierarchical slicer and navigate to the Format pane > Items > Expand/collapse icon: • Icons now scale with font size Here’s an example showing that the icons have scaled to match the text sized, which has been increased to 16 pt:
Ability to customize indentation for child items We’ve added the option for you to now customize the indentation for the child items in the hierarchy.
Supported with AI visuals • Another addition to this release is that the hierarchical slicer is now supported with AI visuals. • Here’s an example where you can see that the hierarchical slicer is cross-filtering the Key influencers visual:
Analytics • AI Insights give you access to a collection of pre-trained machine learning models that enhance your data preparation efforts. • These include text analytics functions (sentiment scoring, key phrase extraction and language detection), image detection as well as connectivity to Azure ML models.
Visualizations Line chart dot formatting options We have a new formatting update to line charts. Now, you can have different colored dots show up for categories across all of your series. This update can help you call out particular points in your line charts.
Template apps • Agile HR Analytics • Agile HR Analytics solution helps you discover useful HR insights for strategic decision making. • Drill through from summary level to individuals. • Monitor diversity metrics . • Analyze absenteeism . • Understand your staff turnover. • See your training effectiveness and analyze your historical data and future trends.
Modeling • Model view enabled for live connect (preview) • When you live connect from Power BI Desktop to an Analysis Service model or a dataset published in the Power BI service, the model view is now enabled. • In the model view, you can see a diagram the remote model. • In this view, you can create multiple layouts of the model, and view and modify report measures properties
Updates to Model view • You can now resize the table containers from any side or corner. • We heard feedback that the dragging functionality made it too easy to accidentally create hierarchies, so that functionality has been removed. If you want to create a hierarchy, you can right-click to create a hierarchy. • Previously, hierarchy levels were sorted alphabetically in the model view. Now, this automatic alphabetical sorting has been omitted. • Some of you may have noticed previously that if you had a field with two colon characters or commas that a relationship arrow would not display or the diagram would gray out. This has been fixed.
Data connectivity • Palantir Foundry connector • Palantir Foundry is a platform that reimagines how people use data by removing the barriers between back-end data management and front-end data analysis. • Foundry enables users with varying technical ability and deep subject matter expertise to work meaningfully with data. • With Foundry, anyone can source, connect, and transform data into any shape they desire, then use it to take action. Source : https://powerbi.microsoft.com/en-us/blog/power-bi-desktop-june-2020-feature-summary/
Choose Anantara Solutions • Anantara, a Microsoft Data Analytics partner, has rich experience in developing Power BI based Descriptive and Predictive Dashboards and Reports. • Our Service offerings include Consulting, Development, Implementation, Support and Maintenance. • Business Analytics is one of the key strategic Solutions of Anantara. • Proactive approach towards providing Business Solutions for Enterprises https://www.anantsol.com/microsoft-dynamics-365-power-bi-services/