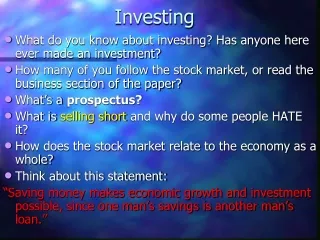
INVESTING STRATEGY
E N D
Presentation Transcript
MY INVESTING STRATEGY BRIG YVR VIJAY
MOST IMPORTANT PART OF STRATEGY MOST IMPORTANT PART OF STRATEGY • Stop loss at 25% of purchase price is very strictly maintained even on Blue Chip Long term holds • As long as other selection parameters are maintained I never sell. • I generally avoid short term trading since I do not understand the same fully • 3 Types of Holds:- • Long Term Performers • Low Cost Good Valuation Currently profitble • Based on a mix of 3 strategies of Financial Strength, Risk and Valuation
SOFTWARE USED SOFTWARE USED • Screener • BSE for NEWS
LONG TERM HOLD STOCKS STRATEGY LONG TERM HOLD STOCKS STRATEGY • Market Capitalisation> 10000 crores • Long Term ROCE is most important parameter • Current ROA and ROE adequate • QOQ and YOY sales and profits should be +ve
(Return on capital employed > 10 AND Return on capital employed preceding year >10 AND Average return on capital employed 3Years > 10 AND Average return on capital employed 5Years > 10 AND Average return on capital employed 7Years>10) AND Return on assets > 20 AND Return on equity > 20 AND PEG Ratio > 0 AND Market Capitalization > 10000 AND QoQ Sales > 0 AND QoQ Profits > 0 AND YOY Quarterly sales growth > 0 AND YOY Quarterly profit growth > 0
STRATEGY 2:LOW COST GOOD VALUATION CURRENTLY PROFITABLE • Looks at PE levels, Earnings growth, quarterly and annual sales and profits • Filter PEG Ratio > 0 AND PEG Ratio < 1 AND Price to Earning > 0 AND Price to Earning < 15 AND Earnings yield > 10 AND QoQ Sales > 10 AND QoQ Profits > 10 AND YOY Quarterly sales growth > 10 AND YOY Quarterly profit growth > 10 AND Return on capital employed > 30 AND Return on equity > 30
STRATEGY 3: CONTINUOUS STRATEGY 3: CONTINUOUS MONITORING STOCKS INCL MONITORING STOCKS INCL SMALL SMALL CAPS USING LOTS OF PARAMETERS VERY SAFE CAPS USING LOTS OF PARAMETERS VERY SAFE • PIOTROSKI SCORE (Financial Performance) • ALTMAN Z SCORE (Risk of Default) • GRAHAM NUMBER (Valuation) • MARKET CAP > 1000 CRS
PIOTROSKI FILTER • The PiotroskiScore is a discrete scorebetween zero and nine that reflects nine criteria used to determine the strength of a firm's financial position. The Piotroski Scoreis used to determine the best value stocks, with nine being the best and zero being the worst. • https://www.investopedia.com/terms/p/piotroski- score.asp#:~:text=The%20Piotroski%20Score%20is%20a%20favorite% 20metric%20used%20to%20judge,is%20not%20a%20good%20value.
KEY ISSUES • The PiotroskiScore is a ranking between zero and nine that incorporates nine factors that speak to a firm's financial strength. • It was named for Joseph Piotroski, a Chicago Accounting Professor who created the scale, based on certain aspects of acorporation's financial statements. • The nine aspects are based on accounting results over a number of years; a point is awarded each time a standard is met, resulting in an overall score. • The PiotroskiScore is a favorite metric used to judge value stocks. • If a company has a score of eight or nine, it is considered a good value. If a company has a score of between zero and two points, it is not a good value.(Can be used for short selling) • I USE ONLY 8+ TO BUY . I sell on my stop loss level which is stop loss 25% below on peak level during my hold
The Piotroski Score is broken down into the following categories: 1.Profitability 2.Leverage, liquidity, and source of funds 3.Operating efficiency Profitability criteria include: •Positive net income (1 point) •Positive return on assets in the current year (1 point) •Positive operating cash flow in the current year (1 point) •Cash flow from operations being greater than net Income (quality of earnings) (1 point) Leverage, liquidity, and source of funds criteria include: •Lower ratio of long term debt in the current period, compared to the previous year (decreased leverage) (1 point) •Higher current ratio this year compared to the previous year (more liquidity) (1 point) •No new shares were issued in the last year (lack of dilution) (1 point). Operating efficiency criteria include: •A higher gross margin compared to the previous year (1 point) •A higher asset turnover ratio compared to the previous year (1 point)
ALTMAN Z SCORE • The Altman Z-score is the output of a credit-strength test that gauges a publicly-traded manufacturing company's likelihood of bankruptcy. • https://www.investopedia.com/terms/a/altman.asp • The Altman Z-score is a formula for determining whether a company, notably in the manufacturing space, is headed for bankruptcy. • The formula takes into account profitability, leverage, liquidity, solvency, and activity ratios. • An Altman Z-score HIGHER THAN 3 suggests a company is in solid financial positioning.
ALTMAN Z PARAMETERS • A = working capital / total assets • B = retained earnings / total assets • C = earnings before interest and tax / total assets • D = market value of equity / total liabilities • E = sales / total assets • The Altman Z-score, a variation of the traditional z-score in statistics, is based on five financial ratios that can be calculated from data found on a company's annual report. The formula for Altman Z-Score is 1.2*(working capital / total assets) + 1.4*(retained earnings / total assets) + 3.3*(earnings before interest and tax / total assets) + 0.6*(market value of equity / total liabilities) + 1.0*(sales / total assets). • ONLY IF SCORE IS 3+ I AM INTERESTED
GRAHAM NUMBER : VALUATION GRAHAM NUMBER : VALUATION The Graham number (or Benjamin Graham's number) measures a stock's fundamental value by taking into account the company's earnings per share (EPS) and book value per share (BVPS). The Graham number is the upper bound of the price range that a defensive investor should pay for the stock. According to the theory, any stock price below the Graham number is considered undervalued and thus worth investing in. If Graham Number > Current Market Price it’s a safe stock to buy
Graham Number Graham Number • The Graham number is a metric to determine the highest price that an investor should pay for a particular stock. • It was developed by legendary value investor Benjamin Graham. • The number is arrived at using a company's earnings and book value, both on a per-share basis. • The Graham number is normalized by a factor of 22.5, to represent an 'ideal' P/E ratio of no more than 15x and a P/B of 1.5x. • The Formula for Graham's Number • Square root(22.5 x EPS X BV PER SHARE) • SCREENER FILTER • Piotroski score > 7 AND • Altman Z Score > 3 AND • Graham Number > Current price AND • Market Capitalization > 1000
THANKS THANKS